7
$\begingroup$

Motivated by a question in MSE, I have the following question:

How can I visualize the envelope of the family of planes $$ 2ax+2by-z+a^2+b^2=0, a,b\in\Bbb{R} $$ which is given by the paraboloid of revolution: $z=-(x^2+y^2)$?


I can use ContourPlot3D to get $z=-(x^2+y^2)$. But I don't see how to draw the family of planes together. Could anyone come up with a visualization?

$\endgroup$

2 Answers 2

9
$\begingroup$

A couple of ideas. Rendering is a problem with transparency and so many planes. Hence the need for "DepthPeelingLayers".

{zsol} = Solve[2 a x + 2 b y - z + a^2 + b^2 == 0, {z}];

family = Graphics3D[
  {Opacity[0.3], Darker@Red, Specularity[White, 10], 
   EdgeForm[Directive[Opacity[0.25], Red]], 
   Table[InfinitePlane[{x, y, z} /. zsol /. Thread[{x, y} -> #] & /@ 
      Most@Tuples[{0, 1}, 2]],
    {a, -2, 2, 2/3}, {b, -2, 2, 2/3}]
   },
  PlotRange -> 2.5, 
  BaseStyle -> {RenderingOptions -> {"DepthPeelingLayers" -> 70}}]
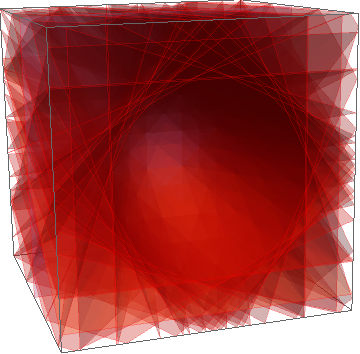
Mathematica graphics

With Opacity[1]:

Mathematica graphics

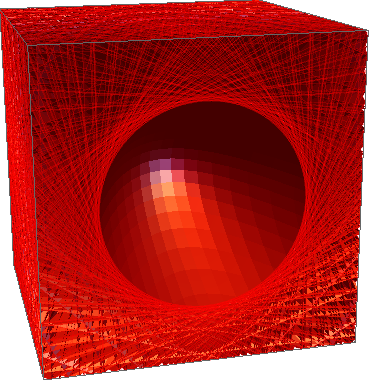
With tangent disks instead of planes, one can start to perceive the outside silhouette of the envelope:

f = 2 a x + 2 b y - z + a^2 + b^2;
norm = D[f, {{x, y, z}}];
env = {x, y, z} /. First@Solve[{# == 0, D[#, a] == 0, D[#, b] == 0}] &[f];
t1 = {norm[[3]], 0, -norm[[1]]};
t2 = Cross[{norm[[3]], 0, -norm[[1]]}, norm];
{t1, t2} = Normalize /@ {t1, t2};

family = Graphics3D[
   {Opacity[0.04], Red, EdgeForm[], 
    Table[Polygon@
      Table[env + 1.5 Cos[t] t1 + 1.5 Sin[t] t2, {t, 0, 2 Pi - 0.1, 
        Pi/4}],
     {a, -2, 2, 1/4}, {b, -2, 2, 1/4}]
    },
   PlotRange -> 2.5];
Style[
 Show[family /. Opacity[_] -> Opacity[0.15], PlotRange -> 2], 
 RenderingOptions -> {"DepthPeelingLayers" -> 150}]
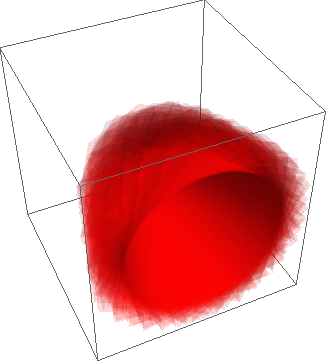
Mathematica graphics

$\endgroup$
3
$\begingroup$

Some manual analyse first. (Currently I failed to think out a way to analyse this with Mathematica.) The envelope shows the region that the family of planes occupies, so if we can decide whether a point in space belongs to the family or not, we can draw the envelope. How to decide? We change the form of the equation a little:

$$ (a+x)^2+(b+y)^2=x^2+y^2+z $$

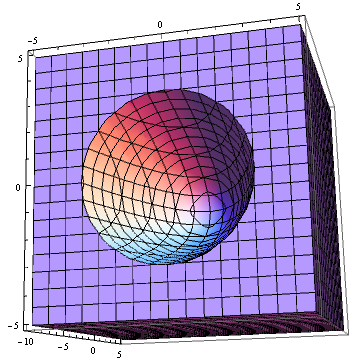
Apparently when $a,b\in\Bbb{R}$ only points that satisfies $x^2+y^2+z\geq 0$ belong to the family. Then it's easy to draw the envelope:

RegionPlot3D[z + x^2 + y^2 >= 0, {x, -5, 5}, {y, -5, 5}, {z, -10, 5}]

enter image description here

…Not that interesting, right? OK, let me show something more.

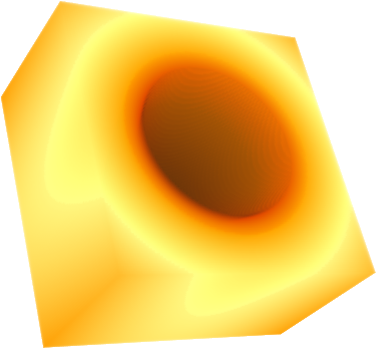
Notice that for any definite $(x, y, z)$, the equation $(a+x)^2+(b+y)^2=x^2+y^2+z$ represents a circle that every points therein represents a possible pair of $(a,b)$, so the perimeter of the circle is proportional to the density of points at a certain location in space. With this in mind, we can draw the spatial density of the family of planes with the following code:

data = Rescale@
   Compile[{}, 
     With[{r = Range[-3, 3, 1/20], z = Range[-3, 1/2, 1/20]}, 
      Sqrt@(# UnitStep@# &)@Table[z + x^2 + y^2, {x, r}, {y, r}]]][];
Image3D@data

enter image description here

$\endgroup$

Your Answer

By clicking “Post Your Answer”, you agree to our terms of service and acknowledge you have read our privacy policy.