8
$\begingroup$

I would like to draw a Graph with defined $x$ coordinates and variable node sizes. If I simply replace the $x$ coordinates of a graph, then nodes can overlap and edges may cross each other. I would appreciate any help pointing me in the right direction on how to go about setting the $Y$ coordinates, or alternative approaches to plotting, such that the nodes are nicely spaced out and, as far as possible, edges don't cross.

(*egdata*)    
relationships = 
 {1 <-> 2, 2 <-> 3, 2 <-> 4, 2 <-> 6, 3 <-> 5, 6 <-> 7,4 <-> 8, 4 <-> 9};
numNodes = 
 Max[relationships[[All, 2]]];
sizes = RandomReal[{0.25, 1}, numNodes];
xCoords = {0, 1, 2, 2, 3, 3, 4, 5, 5};

I would like to be able to automatically generate a plot similar to this (without having to manually specify $Y$ coordinates.):

Graph[
 relationships, VertexSize -> Thread[Range[numNodes] -> sizes], 
 VertexCoordinates -> 
  Transpose[{xCoords,(*yCoords*){1, 1, 1, 3, 2, 1, 2, 3, 4}}]]

Using VertexCoordinateRules with GraphPlot is the best I can do, but doesn't solve the problem:

relationships = 
 {1 -> 2, 2 -> 3, 2 -> 4, 2 -> 6, 3 -> 5, 6 -> 7, 4 -> 8, 4 -> 9};
xCoords = 
 {0, 1, 2, 2, 3, 3, 4, 5, 5};
numNodes = 
 Max[relationships[[All, 2]]];
sizes = RandomReal[{0.25, 1}, numNodes];
GraphPlot[
 relationships,
 VertexCoordinateRules -> 
  Thread[
   Range[numNodes] -> 
   Transpose[{xCoords, Table[Automatic, {numNodes}]}]],   
 VertexRenderingFunction -> ({White, EdgeForm[Black], Disk[#, .3], 
  Black, Text[#2, #1]} &)
]

Thanks in advance!

$\endgroup$
2
  • $\begingroup$ Although this doesn't solve the stated problem ,TreePlot[relationships, Left] looks like it may be useful to you. $\endgroup$ Commented Mar 17, 2015 at 14:21
  • 1
    $\begingroup$ Ignore explicit values of y coordinate first, and instead just track order of nodes/edges (along y axis) on every value of x with a node. Construct set of simple constraining inequalities (joining edge y values need to be equal, non-joining unequal, and no pair of edges must change order in their x interval intersections) to be reduced (or for decision of graph planarity). After this edges are guaranteed to be conceptually non-intersecting, and values of y can be computed on basis of sizes of nodes. Well, this is easier said than done, but I believe that's the most practical approach. $\endgroup$
    – kirma
    Commented Apr 17, 2015 at 20:38

1 Answer 1

4
+25
$\begingroup$

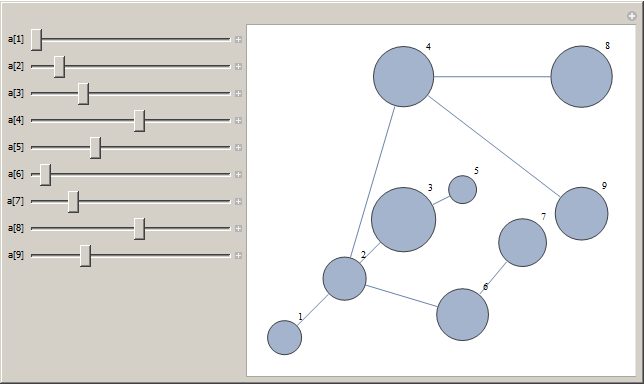
not quite what you asked for, but possibly useful:

relationships = {1 <-> 2, 2 <-> 3, 2 <-> 4, 3 <-> 5, 2 <-> 6, 6 <-> 7,
  4 <-> 8, 4 <-> 9};
numNodes = Max[relationships[[All, 2]]];
sizes = RandomReal[{0.25, 1}, numNodes];
xCoords = {0, 1, 2, 2, 3, 3, 4, 5, 5};
vars0 = Array[a, 9];
Manipulate[
    vars = {a[1], a[2], a[3], a[4], a[5], a[6], a[7], a[8], a[9]};
    p = Graph[relationships, 
    VertexSize -> Thread[Range[numNodes] -> sizes], 
    VertexCoordinates -> Transpose[{xCoords, vars}], 
    VertexLabels -> "Name"] , 
  Evaluate[Sequence @@ 
      Table[{{vars0[[i]], i}, 1, Length@vars0, .1}, {i, Length@vars0}]], 
      TrackedSymbols -> All]

enter image description here

or maybe better using Locator:

 relationships = {1 <-> 2, 2 <-> 3, 2 <-> 4, 3 <-> 5, 2 <-> 6, 6 <-> 7,
        4 <-> 8, 4 <-> 9};
 numNodes = Max[relationships[[All, 2]]];
 v0 = VertexCoordinateRules /.
     First@Cases[GraphPlot[Graph[relationships]], _Rule, Infinity];
 Manipulate[Graph[relationships, VertexCoordinates -> vtx],
         {{vtx, v0}, Locator, Appearance -> None}]
$\endgroup$
1
  • $\begingroup$ Thanks George. Unfortunately, my actual data has hundreds of nodes, so manually setting the coordinates, even in a manipulate, isn't a viable solution. $\endgroup$
    – Daniel S
    Commented Apr 23, 2015 at 13:19

Your Answer

By clicking “Post Your Answer”, you agree to our terms of service and acknowledge you have read our privacy policy.

Not the answer you're looking for? Browse other questions tagged or ask your own question.