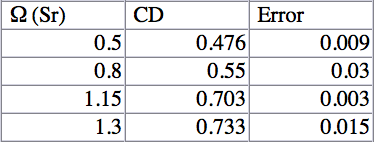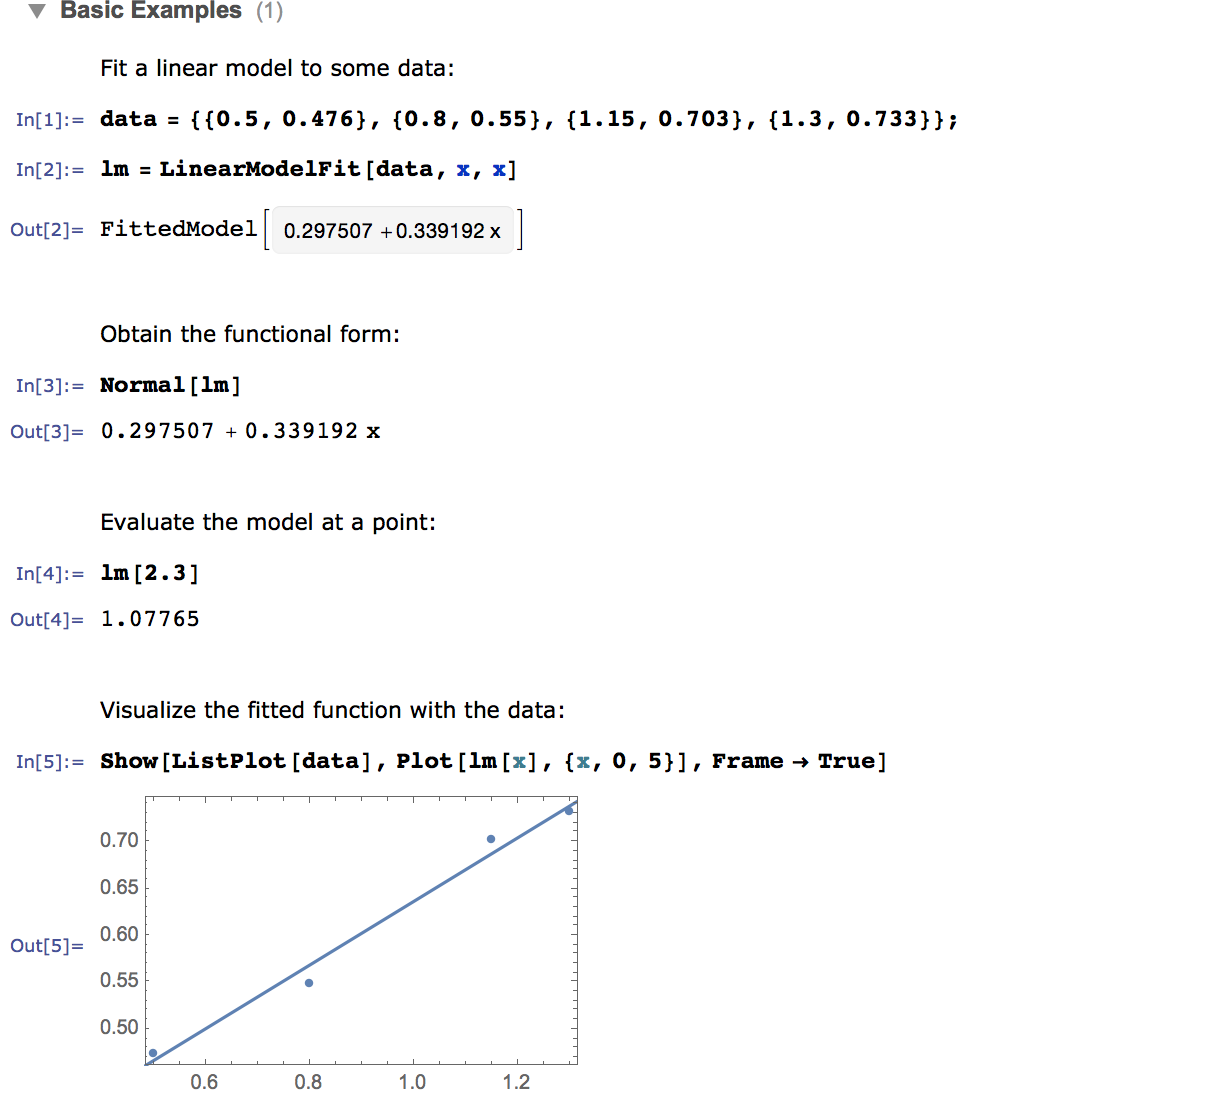
Mathematica ListPlot function allows me to plot the above data with omega on the x-axis and CD on the y-axis

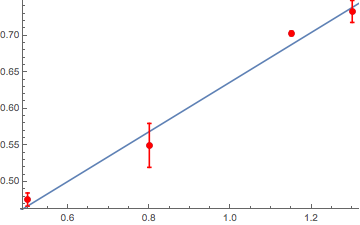
1) How do I incorporate the error bars in my data on the graph? 2) Are there any basis statistical analysis I could possibly extract from my exists data table?


Needs["ErrorBarPlots`"]$\endgroup$