1
$\begingroup$

So I have many CSV files in format like this:

2014-12-11T16:13:13.038337Z , 3.90092

2014-12-11T16:14:13.456558Z , 3.89734

2014-12-11T16:15:12.444318Z , 3.90092

I imported a CSV file with data = Import["file.csv","CSV"]

What should I do to get Mathematica to plot the date/time against the y-value? Do I need to convert the time format first? If so, how do I go about doing that?

$\endgroup$
0

1 Answer 1

3
$\begingroup$

Supposing you import the file so that it produces the following structure..

data = {
  {"2014-12-11T16:13:13.038337Z", 3.90092}, 
  {"2014-12-11T16:14:13.456558Z", 3.89734},
  {"2014-12-11T16:15:12.444318Z", 3.90092}}

You would then be best off converting it to a TimeSeries object which is fairly clever about parsing dates automatically.

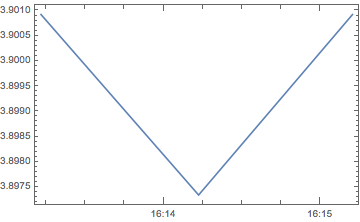
ts = TimeSeries[data]
DateListPlot[ts]

enter image description here

If for some reason the dates don't get handled the way you expect you will need to convert them with DateString and specify the particular date-time format prior to feeding into TimeSeries.

$\endgroup$

Your Answer

By clicking “Post Your Answer”, you agree to our terms of service and acknowledge you have read our privacy policy.

Not the answer you're looking for? Browse other questions tagged or ask your own question.