14
$\begingroup$

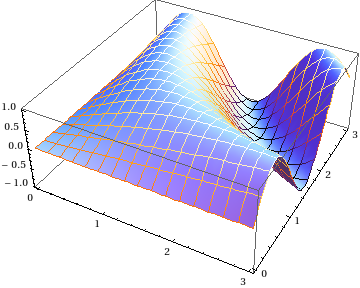
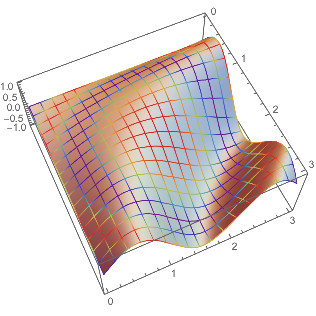
This is an example given in Help:

Plot3D[Sin[x y], {x, 0, 3}, {y, 0, 3}, MeshStyle -> Gray]

Could this be changed to something like

Plot3D[Sin[x y], {x, 0, 3}, {y, 0, 3}, MeshStyle -> "SunsetColors"]

The above line does not work, but is there a way to modify syntax so that "SunsetColors" can be used?

$\endgroup$
1
  • 3
    $\begingroup$ Unfortunately, MeshStyle acts more like PlotStyle than ColorFunction; thus, you'll need to use something like ParametricPlot3D[] to get mesh lines with parameter-dependent coloring. $\endgroup$ Commented Jun 17, 2012 at 1:36

7 Answers 7

3
$\begingroup$

Here is the method you posted as an answer yourself, condensed by exploiting repetitious code.

Module[{a, d, t, p, kx, ky, func, cf, plot1, plot2},
 a = 1.42;   d = a Sqrt[3];   t = 2.8;   p = 25;

 func := t Sqrt[3 + 2 Cos[a kx] + 4 Cos[a/2 kx] Cos[d/2 ky]];

 cf[1] = ColorData["SunsetColors", #3] &;
 cf[-1] = ColorData["SunsetColors", 1 - #3] &;

 plot1 = Plot3D[#3 func, {#, -2 Pi / a, 2 Pi / a}, {#2, -2 Pi / a, 2 Pi / a},
    ColorFunction -> cf[#3], BoundaryStyle -> None, Mesh -> None, PlotPoints -> p] &;

 plot2 = ParametricPlot3D[
    Table[{kx, ky, #3 func}, {#2, -2 Pi / a, 2 Pi / a, 1/2}],
    {#, -2 Pi / a, 2 Pi / a}, ColorFunction -> cf[#3], 
    PlotStyle -> Directive[Thickness[0.002]], PlotPoints -> p] &;

 Show[
  plot1[kx, ky, #] & /@ {1, -1},
  plot2[kx, ky, #] & /@ {1, -1},
  plot2[ky, kx, #] & /@ {1, -1},

  PlotRange -> All,
  BoxRatios -> {1, 0.75, 0.75},
  AxesLabel -> 
   Map[Style[#, Large, Bold] &, {Subscript[k, x], Subscript[k, y], Ε[OverVector[k]]}],
  ImageSize -> {800, 800},
  ViewPoint -> {-3, -2, 0}
 ]
] 
$\endgroup$
1
  • $\begingroup$ Mr. Wizard, this looks awesome, thank you for your help! $\endgroup$ Commented Jun 19, 2012 at 13:10
11
$\begingroup$

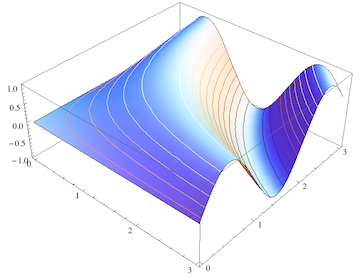
Actually, there is one way to make mesh lines with variable colors: if you specify lists with equal number of elements for both, MeshFunctions and MeshStyle, then each of the styles in MeshStyle gets applied to the corresponding mesh lines specified in MeshFunctions.

This fact can be used in a multitude of ways, and specifically for this question we can get something like a height-dependent mesh coloring. It is not the same as what J.M. does because in my case the color doesn't vary along a given mesh line, but instead from line to line.

Module[
 {offset, range,
  (* I assume we know the minimum and maximum of the function: *)
  zMin = -1, zMax = 1,
  (* this is the number of mesh lines to be drawn: *)
  nMesh = 10
  },
 (* range is the list of z values at which to draw a contour line: *)
  range = Range[(zMax - zMin)/nMesh/2, 
   zMax - zMin, (zMax - zMin)/nMesh];
 Plot3D[
  Sin[x y], {x, 0, 3}, {y, 0, 3},
  MeshFunctions ->
   Map[Function[{x, y, z}, z - offset] /. offset -> # &, range],
  Mesh -> {{zMin}}, 
  MeshStyle -> Map[ColorData["SunsetColors"], Rescale[range]]]
 ]

height contours

The height contours are created as follows: There is only a single value in Mesh -> {{zMin}} but there are nMesh ( = 10) mesh functions. Each of them takes the automatically provided argument #3 and calls it z, then defines a "foliation" parallel to the xy plane at a height that is offset from the minimum height (zMin) by a value offset. This offset is varied in steps of (zMax - zMin) / nMesh to generate a whole list of mesh functions by means of the Map command.

In the corresponding MeshStyle option, an equally long list of SunsetColors is generated from the same offset range after rescaling it.

Edit

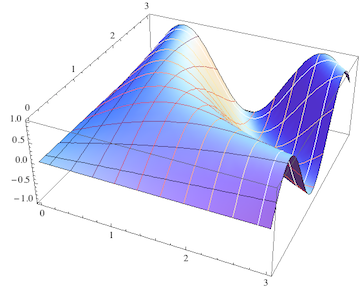
To show that one can also get the conventional rectangular grid of mesh lines with variable colors, here is a straightforward modification of the previous example:

Module[{offset, range,
  (* As in the simple example, x and y range have identical limits:*)
    xMin = 0, xMax = 3,
  (*this is the number of mesh lines to be drawn:*)
  nMesh = 10},
 (*range is the list of x or y values at which to draw a mesh line:*)
  range = 
  Range[(xMax - xMin)/nMesh/2, xMax - xMin, (xMax - xMin)/nMesh];
 Plot3D[
  Sin[x y], {x, xMin, xMax}, {y, xMin, xMax},
  MeshFunctions -> Join[
    Map[
     Function[{x, y, z}, x - offset] /. offset -> # &,
     range
     ],
    Map[
     Function[{x, y, z}, y - offset] /. offset -> # &,
     range
     ]
    ],
  Mesh -> {{xMin}},
  MeshStyle -> Map[ColorData["SunsetColors"], Rescale[range]]
  ]
 ]

rectangular mesh

Again this differs from all the other answers (except Brett's which just appeared when I updated this) in that it actually uses Mesh lines as was requested in the original question. But the coloring here is now governed by the value of the x (or y) coordinate at which the mesh line resides.

This can in some cases be very useful, I think. If we color the mesh lines in exactly the same way as the surface, that may look more harmonic but is ultimately redundant. I could get a reasonably unobtrusive mesh by simply using MeshStyle->Directive[White,Opacity[.1]].

On the other hand, with the coloring I chose, the mesh color actually contains important additional visual cues that differ from the information in the face colors.

In particular, if the intended application is a band diagram, the color of the mesh lines reveals at a glance for which constant value of the wave vector component $k_x$ (or $k_y$) the mesh line intersects the energy surface (without the color information, you have to carefully count the mesh lines from the border to find your position in $\vec{k}$ when the band has many ups and downs).

$\endgroup$
2
  • $\begingroup$ "I assume we know the minimum and maximum of the function" - I suppose that if you don't, AbsoluteOptions[(* stuff *), PlotRange] could be a starting point... $\endgroup$ Commented Jun 17, 2012 at 3:26
  • $\begingroup$ @J.M. Yes - that would be an added convenience if one were to make this into a function. I just wanted to point out the general idea. $\endgroup$
    – Jens
    Commented Jun 17, 2012 at 3:28
9
$\begingroup$

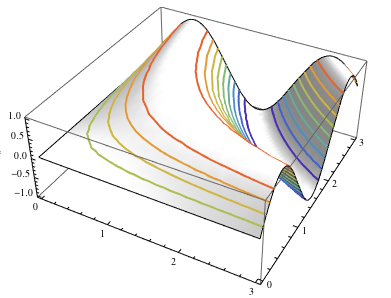
Mesh can take a list of {value, style} pairs. Here we use MeshFunctions to set the mesh to be height contours, and the Mesh specification for the heights is a list of elements like {-2/5, RGBColor[0.29796, 0.565793, 0.752239]}:

Plot3D[Sin[x y], {x, 0, 3}, {y, 0, 3}, Lighting -> "Neutral", 
   MeshFunctions -> {#3 &},
   Mesh -> {Table[
      {i, ColorData["Rainbow", Rescale[i, {-1, 1}]]}, 
      {i, -1, 1, 1/5}]}]

enter image description here

I set Lighting -> "Neutral" so the colored lines would show up better (and the screenshot is additionally using Thick lines.)

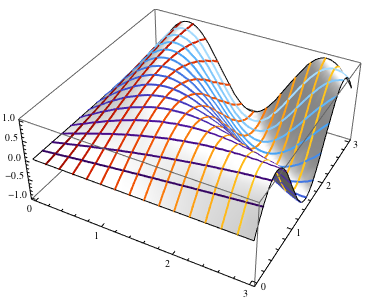
Note the extra level of lists around the Table; this makes sure that the entire set of values/styles is associated with the heights. It's a bit clearer when we have multiple sets of mesh lines ($x$ and $y$ values, in this case):

Plot3D[Sin[x y], {x, 0, 3}, {y, 0, 3}, Lighting -> "Neutral", 
   MeshFunctions -> {#1 &, #2 &}, 
   Mesh -> {
      Table[{i, ColorData["SolarColors", Rescale[i, {0, 3}]]}, {i, 0, 3, 1/5}],
      Table[{i, ColorData["DeepSeaColors", Rescale[i, {0, 3}]]}, {i, 0, 3, 1/5}]
      }]

enter image description here

$\endgroup$
1
  • $\begingroup$ (+1) I just added the same kind of plot as your last one, but used a different packaging... $\endgroup$
    – Jens
    Commented Jun 18, 2012 at 4:08
7
$\begingroup$

Here's how to fake that functionality you want for the time being:

Show[
 Plot3D[Sin[x y], {x, 0, 3}, {y, 0, 3}, BoundaryStyle -> None, Mesh -> None], 
 ParametricPlot3D[Table[{x, y, Sin[x y]}, {y, 0, 3, 3/16}], {x, 0, 3},
   ColorFunction -> (ColorData["SunsetColors", #3] &)], 
 ParametricPlot3D[Table[{x, y, Sin[x y]}, {x, 0, 3, 3/16}], {y, 0, 3},
   ColorFunction -> (ColorData["SunsetColors", #3] &)]]

mesh with parameter-dependent coloring

It shouldn't be too hard to make a routine out of this...

$\endgroup$
5
$\begingroup$

enter image description here

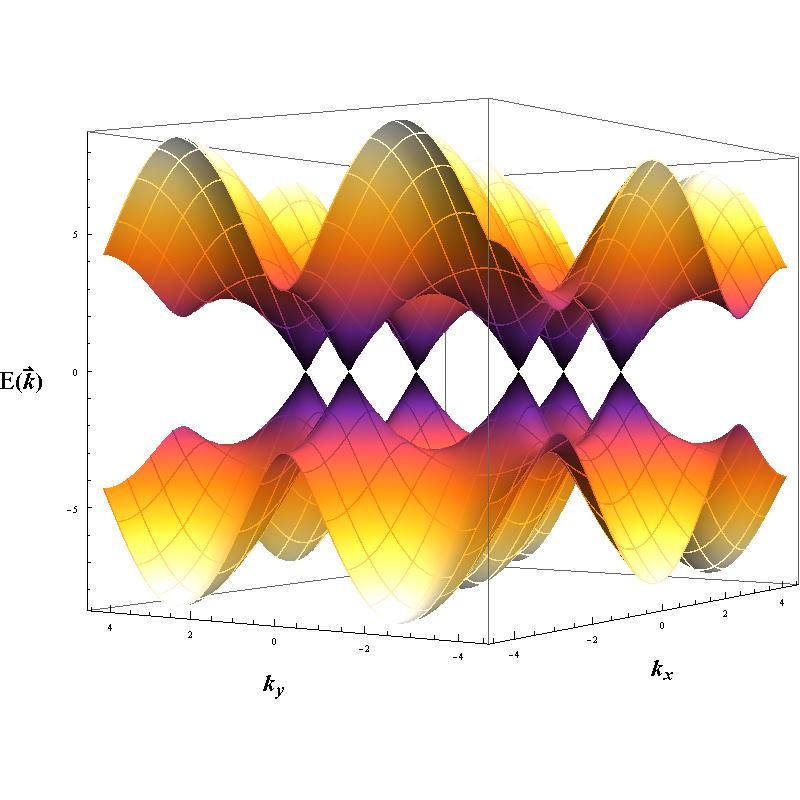
I used J.M.s suggestion. Combining the plot of the function itself with parametric plots of independent "meshes" of the right color. I was plotting the dispersion relation for graphene, so my function was somewhat more complicated than the Sin[] function in the help files of Mathematica. Thank you very much for your help. I am very pleased by what I came up with! Here is the code:

a = 1.42; (*carbon-carbon bond length in \[Angstrom]*) 
d = a Sqrt[3];(*graphene lattice parameter,2.46, in \[Angstrom]*)
t = 2.8; (*hopping parameter*)
p = 25;(*points to plot*)
Show[Plot3D[
t Sqrt[3 + 2 Cos[a kx] + 4 Cos[a/2 kx] Cos[d/2 ky]], {kx, -((2 Pi)/ a), (2 Pi)/a}, {ky, -((2 Pi)/a), (2 Pi)/a}, 
ColorFunction -> "SunsetColors", BoundaryStyle -> None, 
Mesh -> None, PlotPoints -> p ],
ParametricPlot3D[
Table[{kx, ky, 
t Sqrt[3 + 2 Cos[a kx] + 4 Cos[a/2 kx] Cos[d/2 ky]]}, {ky, -((
 2 Pi)/a), (2 Pi)/a, 1/2}], {kx, -((2 Pi)/a), (2 Pi)/a}, 
ColorFunction -> (ColorData["SunsetColors", #3] &), 
PlotStyle -> Directive[Thickness[0.002]], PlotPoints -> p], 
ParametricPlot3D[
Table[{kx, ky, 
t Sqrt[3 + 2 Cos[a kx] + 4 Cos[a/2 kx] Cos[d/2 ky]]}, {kx, -((
 2 Pi)/a), (2 Pi)/a, 1/2}], {ky, -((2 Pi)/a), (2 Pi)/a}, 
ColorFunction -> (ColorData["SunsetColors", #3] &), 
PlotStyle -> Directive[Thickness[0.002]], PlotPoints -> p], 
Plot3D[-t Sqrt[3 + 2 Cos[a kx] + 4 Cos[a/2 kx] Cos[d/2 ky]], {kx, -((
2 Pi)/a), (2 Pi)/a}, {ky, -((2 Pi)/a), (2 Pi)/a}, 
ColorFunction -> ColorData[{"SunsetColors", "Reverse"}], 
BoundaryStyle -> None, Mesh -> None, PlotPoints -> p],
ParametricPlot3D[
Table[{kx, 
ky, -t Sqrt[
  3 + 2 Cos[a kx] + 4 Cos[a/2 kx] Cos[d/2 ky]]}, {ky, -((2 Pi)/
 a), (2 Pi)/a, 1/2}], {kx, -((2 Pi)/a), (2 Pi)/a}, 
ColorFunction -> (ColorData[{"SunsetColors", "Reverse"}, #3] &), 
PlotStyle -> Directive[Thickness[0.002]], PlotPoints -> p], 
ParametricPlot3D[
Table[{kx,  ky, -t Sqrt[ 3 + 2 Cos[a kx] + 4 Cos[a/2 kx] Cos[d/2 ky]]}, 
{kx, -((2 Pi)/ a), (2 Pi)/a, 1/2}], 
{ky, -((2 Pi)/a), (2 Pi)/a}, 
ColorFunction -> (ColorData[{"SunsetColors", "Reverse"}, #3] &), 
PlotStyle -> Directive[Thickness[0.002]], PlotPoints -> p], 
PlotRange -> All, BoxRatios -> {1, 0.75, 0.75}, 
AxesLabel -> {Style[Subscript[k, x], Large, Bold], 
Style[Subscript[k, y], Large, Bold], 
Style[\[CapitalEpsilon][OverVector[k]], Large, Bold]}, 
ImageSize -> {800, 800}, ViewPoint -> {-3, -2, 0}]

(edit by J.M.)

Here's a slight simplification:

a = 1.42;(*carbon-carbon bond length in Å*)
t = 2.8;(*hopping parameter*)
p = 25;(*points to plot*)
n = 16;(*mesh lines*)

grapheneDispersion[a_, t_][kx_, ky_] :=
   With[{d = a Sqrt[3](*graphene lattice parameter, 2.46, in Å*)},
         t Sqrt[3 + 2 Cos[a kx] + 4 Cos[a/2 kx] Cos[d/2 ky]]];

Show[
 Plot3D[grapheneDispersion[a, t][kx, ky], {kx, -2 Pi/a, 
   2 Pi/a}, {ky, -2 Pi/a, 2 Pi/a}, ColorFunction -> "SunsetColors", 
  BoundaryStyle -> None, Mesh -> None, PlotPoints -> p], 
 ParametricPlot3D[
  Table[{kx, ky, grapheneDispersion[a, t][kx, ky]}, {ky, -2 Pi/a, 
    2 Pi/a, 4 Pi/a/n}], {kx, -2 Pi/a, 2 Pi/a}, 
  ColorFunction -> (ColorData["SunsetColors", #3] &), 
  PlotStyle -> Directive[Thickness[0.002]], PlotPoints -> p], 
 ParametricPlot3D[
  Table[{kx, ky, grapheneDispersion[a, t][kx, ky]}, {kx, -2 Pi/a, 
    2 Pi/a, 4 Pi/a/n}], {ky, -2 Pi/a, 2 Pi/a}, 
  ColorFunction -> (ColorData["SunsetColors", #3] &), 
  PlotStyle -> Directive[Thickness[0.002]], PlotPoints -> p], 
 Plot3D[-grapheneDispersion[a, t][kx, ky], {kx, -2 Pi/a, 
   2 Pi/a}, {ky, -2 Pi/a, 2 Pi/a}, 
  ColorFunction -> ColorData[{"SunsetColors", "Reverse"}], 
  BoundaryStyle -> None, Mesh -> None, PlotPoints -> p], 
 ParametricPlot3D[
  Table[{kx, ky, -grapheneDispersion[a, t][kx, ky]}, {ky, -2 Pi/a, 
    2 Pi/a, 4 Pi/a/n}], {kx, -2 Pi/a, 2 Pi/a}, 
  ColorFunction -> (ColorData[{"SunsetColors", "Reverse"}, #3] &), 
  PlotStyle -> Directive[Thickness[0.002]], PlotPoints -> p], 
 ParametricPlot3D[
  Table[{kx, ky, -grapheneDispersion[a, t][kx, ky]}, {kx, -2 Pi/a, 
    2 Pi/a, 4 Pi/a/n}], {ky, -2 Pi/a, 2 Pi/a}, 
  ColorFunction -> (ColorData[{"SunsetColors", "Reverse"}, #3] &), 
  PlotStyle -> Directive[Thickness[0.002]], PlotPoints -> p],
 AxesLabel -> Evaluate[Style[#, Large, Bold] & /@ {Subscript[k, x], 
     Subscript[k, y], Ε[OverVector[k]]}], 
 BoxRatios -> {1, 0.75, 0.75}, ImageSize -> {800, 800}, 
 PlotRange -> All, ViewPoint -> {-3, -2, 0}]
$\endgroup$
5
  • $\begingroup$ +1 for sharing your result. You could make this code a lot shorter by exploiting similarities. Would you like help doing that? $\endgroup$
    – Mr.Wizard
    Commented Jun 17, 2012 at 20:36
  • $\begingroup$ Dear Mr. Wizard, thanks for the "+1". Shorter is always better!!! Do you have a suggestion? I originally defined a function for the energy dispersion relationship to shorten the code, but when I received J.M.s answer, I just went for the brute force approach and started subbing the function itself into his solution. I would appreciate to see your solution. Thanks in advance for your help. R. Frog $\endgroup$ Commented Jun 17, 2012 at 21:26
  • $\begingroup$ I've been out for the day. If I have time this evening I'll make a condensed version and post it as an answer. $\endgroup$
    – Mr.Wizard
    Commented Jun 18, 2012 at 1:59
  • $\begingroup$ Code posted below for your review. If you have any questions please ask. I had to change your color function a bit because version 7 doesn't support ColorData[{"SunsetColors", "Reverse"}] but otherwise it was a straight translation. $\endgroup$
    – Mr.Wizard
    Commented Jun 18, 2012 at 23:03
  • $\begingroup$ Nice. I was reading this when I came across your plot. There's one very similar in the thesis. Turns out both are related, uh? $\endgroup$
    – CHM
    Commented Aug 15, 2012 at 7:54
5
$\begingroup$

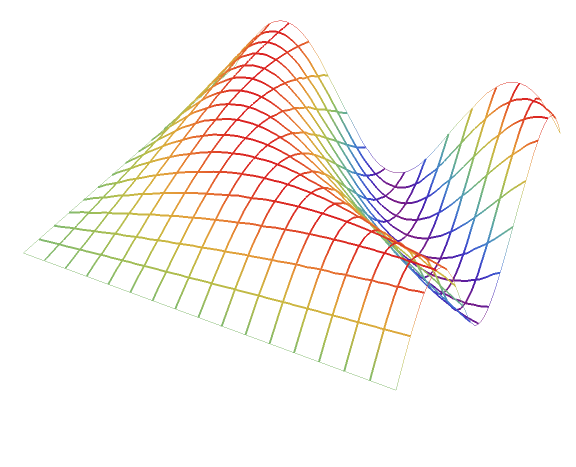
When the option ColorFunction is used, mesh (and boundary) lines are rendered as Line[coordinateindexlist, VertexColors -> None].

So if we simply replace VertexColors -> None with VertexColors -> Automatic, then the vertex colors will be picked from the VertexColors option setting in the enclosing GraphicsComplex.

Define

f = ReplaceAll[Rule[VertexColors, None] -> Rule[VertexColors, Automatic]];

We can use f in three alternative ways to get the same picture:

  1. post-process Plot3D output with f
  2. add the option DisplayFunction -> f to Plot3D[...]
  3. use the option MeshStyle -> ({Thick, f @ #} &) in Plot3D[...]

Examples:

plot1  = f @ Plot3D[Sin[x y], {x, 0, 3}, {y, 0, 3}, PlotStyle -> FaceForm[], 
  MeshStyle -> Thick, ColorFunction -> "Rainbow", Boxed -> False, 
  Axes -> False, Lighting -> "Neutral"]

enter image description here

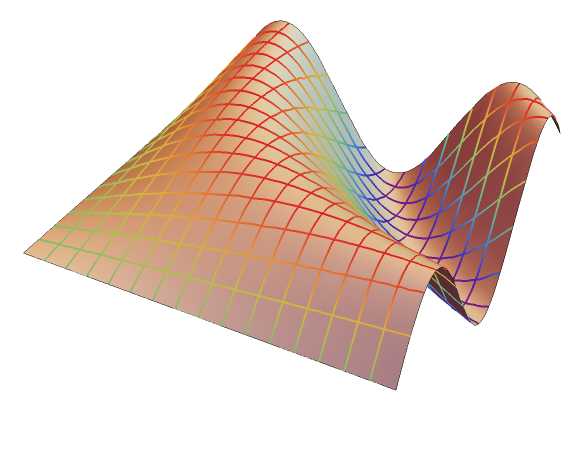
To add the surface (with plot style from Michael E2's answer)

plot2 = Plot3D[Sin[x y], {x, 0, 3}, {y, 0, 3}, 
   PlotStyle -> Directive[Specularity[0], LightGray], 
   Mesh -> None];

Show[plot1, plot2] 

enter image description here

OP's example:

a = 1.42;   d = a Sqrt[3];   t = 2.8;   p = 25;

function[kx_, ky_] := t Sqrt[3 + 2 Cos[a kx] + 4 Cos[a/2 kx] Cos[d/2 ky]];

{minz, maxz} = Through @ {MinValue, MaxValue}[{function[x, y], 
    -2 Pi/a <= x <= 2 Pi/a, -2 Pi/a <= y <= 2 Pi/a}, {x, y}] 

cF = If[minz <= #3 <= maxz,
  ColorData[{"SunsetColors", {minz, maxz}}] @ #3, 
  ColorData[{"SunsetColors",-{minz, maxz}}] @ #3] &;

plotOP = Plot3D[{function[kx, ky], -function[kx, ky]}, 
   {kx, -2 Pi / a, 2 Pi / a}, {ky, -2 Pi / a, 2 Pi / a},
   ColorFunction -> cF,
   ColorFunctionScaling -> False, 
   BoundaryStyle -> None,  
   PlotPoints -> p, 
   PlotRange -> All,
   BoxRatios -> {1, 0.75, 0.75}, 
   Boxed -> False, 
   MeshStyle -> Directive[Thickness[0.002]], 
   Axes -> False,
   ImageSize -> {800, 800},
   ViewPoint -> {-3, -2, 0}] 
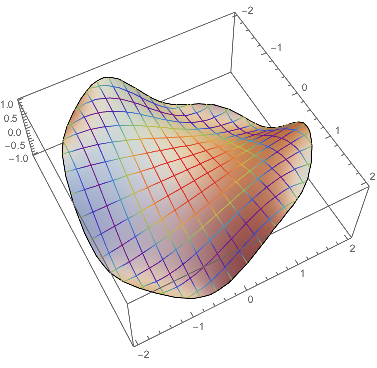
 f @ plotOP

enter image description here

$\endgroup$
3
$\begingroup$

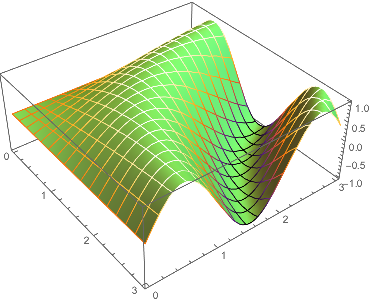
Here's a way to imitate the gradient effect of color functions by post-processing the line in the graphics. Note that the boundary lines are affected, too. One might avoid coloring them in this example, but in general, regions, exclusions, and so forth would make detecting the boundary more difficult. It could be done by usual a signal value (see below). The coordinates are rescaled, as they are by default in usual color function.

With[{plot = Plot3D[Sin[x y], {x, 0, 3}, {y, 0, 3}, 
    PlotStyle -> Directive[Specularity[0], Lighter[Green, 0.5]]]},
 With[{cf = ColorData["SunsetColors"][#3] &},
  plot /. GraphicsComplex[pts_, g_, opts___] :>
    GraphicsComplex[pts,
     g /. Line[p_] :> Line[p,
        VertexColors -> MapThread[cf, Part[Rescale /@ Transpose[pts], All, p]]],
     opts]
  ]]

Mathematica graphics

Another example, with a more complicate color function:

With[{plot = Plot3D[Sin[x y], {x, 0, 3}, {y, 0, 3}, 
    PlotStyle -> Directive[Specularity[0], LightGray]]},
 With[{cf = ColorData["Rainbow"][Cos[10 #.#]^2 &[{#1, #2} - 0.5]] &},
  plot /. GraphicsComplex[pts_, g_, opts___] :>
    GraphicsComplex[pts,
     g /. Line[p_] :> Line[p,
        VertexColors -> MapThread[cf, Part[Rescale /@ Transpose[pts], All, p]]],
     opts]
  ]]

Mathematica graphics

One can leave out Rescale to get the actual coordinates passed to the color function.

We can avoid coloring the boundary by using the usual color Hue[1/Pi] to style the boundary.

With[{plot = Plot3D[Sin[x y], {x, y} ∈ Disk[{0, 0}, 2],
    BoundaryStyle -> Hue[1/Pi], PlotStyle -> Directive[Specularity[0], LightGray]]},
 With[{cf = ColorData["Rainbow"][Cos[10 #.#]^2 &[{#1, #2} - 0.5]] &},
  plot /. GraphicsComplex[pts_, g_, opts___] :>
    GraphicsComplex[pts,
     g /. {l_List?(MemberQ[#, Hue[1/Pi]] &) :>      (* style the boundary *)
         (l /. Hue[1/Pi] -> Black),
       Line[p_] :> Line[p,                          (* style the mesh lines *)
         VertexColors -> MapThread[cf, Part[Rescale /@ Transpose[pts], All, p]]]},
     opts]
  ]]

Mathematica graphics

$\endgroup$

Your Answer

By clicking “Post Your Answer”, you agree to our terms of service and acknowledge you have read our privacy policy.

Not the answer you're looking for? Browse other questions tagged or ask your own question.