Is there a convenient way to format tick labels? In this example I would like to use the default Mathematica tick intervals, but simply convert the X axis labels to strings with "s" added.
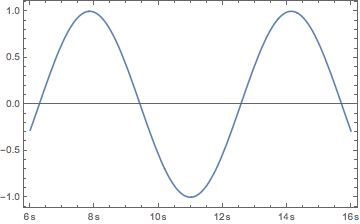
As you can see below, by default Mathematica shows six X axis labels, with three subticks, although for different plot ranges both can vary:
plotA = Plot[Sin[x], {x, 6, 16}, Frame -> True]
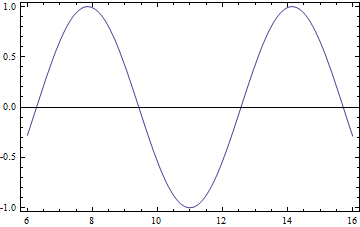
A basic function can be defined to add the "s" formatting, but it doesn't vary as the Mathematica range would. Adding subticks would be further work, and the upper X frame would have to be defined too, to match the intervals.
frametickfunction[xmin_, xmax_] :=
 {#, ToString[#] <> "s"} & /@ FindDivisions[{xmin, xmax}, 6]

plotB = Plot[Sin[x], {x, 6, 16}, Frame -> True,
 FrameTicks -> {{True, True}, {frametickfunction, True}}]
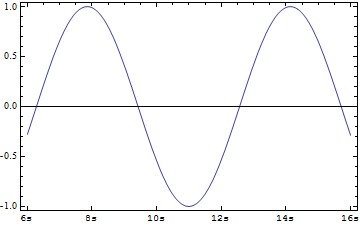
It would be convenient if I could obtain the X axis specification produced in plotA, modify it, and use it in plotB. Is this possible, or are there other methods?

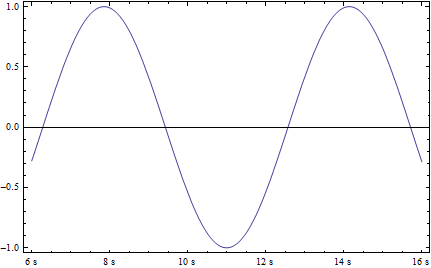
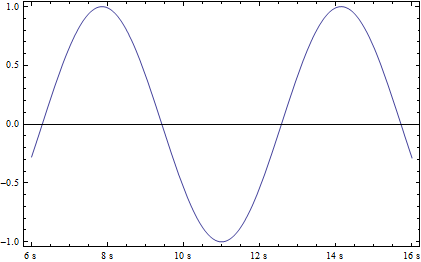
AbsoluteOptions[]is supposed to be the solution for this, but it seems it doesn't do what it's supposed to do in these recent versions of Mathematica... $\endgroup$