I calculate the Kolmogrov-samirnov test statistic for the following data:
R = {0.171434, 0.134263, 0.155931, 0.135479, 0.196356, 0.152357,
  0.133084, 0.10537, 0.14654, 0.116676, 0.123145, 0.145377, 0.12366,
  0.156681, 0.208564, 0.202139, 0.227931, 0.15622, 0.118042,
  0.104006, 0.322, 0.327, 0.331, 0.34, 0.383, 0.454}
with weibull distribution with parameters (3.08, 5.39) and it was
0.226532
but i recalculate it by excel by the same data and same parameters then the result was
0.614
so i want help to know the formula behind the Kolmogorov-Smirnov test statistic in mathematica
the formula behind the Kolmogorov-Smirnov test statistic in excel is
D=max|i/n-CDF|
Thanks
-
$\begingroup$ I can't replicate your result of 0.226532 using the distribution you suggest. $\endgroup$– Andy RossCommented Nov 17, 2014 at 15:17
-
$\begingroup$ i used the weibull distribution with pdf = a b^a E^-(b x)^a x^(-1 + a) but mathematica uses the pdf=(a E^-(x/b)^a (x/b)^(-1 + a))/b $\endgroup$– MomoCommented Nov 17, 2014 at 17:26
2 Answers
You have likely made an error in computing the test statistic by not sorting R and by using incorrect limits on empirical CDF values.
R = {0.171434, 0.134263, 0.155931, 0.135479, 0.196356, 0.152357,
   0.133084, 0.10537, 0.14654, 0.116676, 0.123145, 0.145377, 0.12366,
   0.156681, 0.208564, 0.202139, 0.227931, 0.15622, 0.118042,
   0.104006, 0.322, 0.327, 0.331, 0.34, 0.383, 0.454};

dist = WeibullDistribution[3.08, 1/5.39];
n = Length[R];

Max[Abs[Range[0,n-1]/n - CDF[dist, Sort@R]]]

(* 0.226532 *)
This is precisely what we get using the built in test.
KolmogorovSmirnovTest[R, dist, "TestStatistic"]

(* 0.226532 *)
I can replicate what you found in Excel by shifting the empirical values by one and by not sorting R.
Max[Abs[Range[1,n]/n - CDF[dist, R]]]

(* 0.614413 *)
The implementation in Mathematica is more general than this method. If you happen to have ties in the data then you have to actually compute the empirical CDF or they won't be handled properly. For example...
SeedRandom[1];
r2 = RandomChoice[R, n];

Max[Abs[Range[0, n - 1]/n - CDF[dist, r2]]]

(* 0.762458 *)
Which is not equivalent to the correct value...
MaxValue[Abs[CDF[EmpiricalDistribution[r2], x] - CDF[dist, x]], {x}]

(* 0.150597 *)
KolmogorovSmirnovTest >> Details and Options says:
and
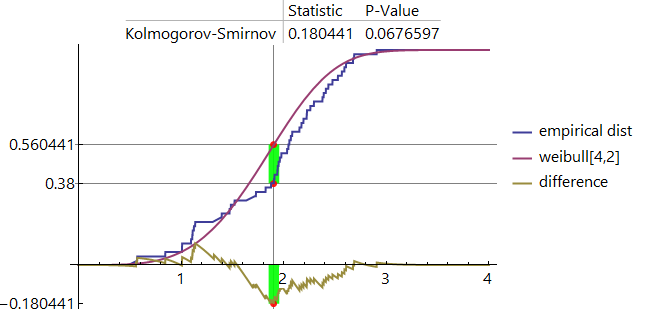
Example:
wd = WeibullDistribution[4, 2];
data = RandomVariate[wd, 50];
ed = EmpiricalDistribution[data];
f1 = CDF[ed, #] &;
f2 = CDF[wd, #] &;
kspv = KolmogorovSmirnovTest[data, wd]
(* 0.0676597 *)
ksts = KolmogorovSmirnovTest[data, wd, "TestStatistic"]
(* 0.180441 *)
MaxValue[{Abs[f1[x] - f2[x]], 0 < x < 5}, {x}]
(* 0.180441 *)

KolmogorovSmirnovTest[data, wd, "TestDataTable"]

In a picture:
xv = ArgMax[{Abs[f1[x] - f2[x]], 0 < x < 5}, {x}][[1]];
yv = Through@{f1[#] - f2[#] &, f1, f2}@xv;
points = Thread[{xv, yv}];
tsttable = MapAt[Style[#, "Panel", 16] &,KolmogorovSmirnovTest[data, wd, "TestDataTable"], {{1}}];
legends = (Style[#, "Panel", 16] & /@ {"empirical dist", "weibull[4,2]", "difference"});
Plot[{f1[x], f2[x], f1[x] - f2[x]}, {x, 0, 4}, Exclusions -> None, PlotStyle -> Thick,
 PlotLegends -> legends, ImageSize -> 500, LabelStyle -> {"Panel", 16},
 GridLines -> ({{xv}, Rest@yv}),  Ticks -> {Automatic, yv},
 Prolog -> {Thickness[.025], Opacity[.9], Green, CapForm["Butt"], Line[Rest@points],
    Line[{First@points, {xv, 0}}], PointSize[Large], Red,    Point[points],},
 PlotLabel -> tsttable]

-
$\begingroup$ thanks for interest, why you enter 5 in: MaxValue[{Abs[f1[x] - f2[x]], 0 < x < 5}, {x}] ? $\endgroup$– MomoCommented Nov 16, 2014 at 8:19
-
$\begingroup$ In fact, I think it is more simply to use direct method like excel see real-statistics.com/non-parametric-tests/… than this Mathematica complicated method $\endgroup$– MomoCommented Nov 16, 2014 at 8:30


