5
$\begingroup$

How is the thickness defined in ParametricPlot3D? For 2D plots, the thickness "is given as a fraction of the horizontal plot range," but how does that work in 3D for the following example? Also, it doesn't seem that AbsoluteThickness works.

Moebius[R_, a_, b_] := {(R + a Cos[b/2]) Cos[b], (R + a Cos[b/2]) Sin[b], a Sin[b/2]}

MBand = ParametricPlot3D[Moebius[5, a, b], {a, -1, 1}, {b, 0, 2 Pi}, 
  Mesh -> None, PlotPoints -> {20, 100}, MaxRecursion -> 0, 
  PlotRange -> All, 
  PlotStyle -> Directive[{Thickness[1], Opacity[0.5]}]]
$\endgroup$
1

1 Answer 1

5
$\begingroup$

The three argument form of ParametricPlot3D

enter image description here

i.e, it produces a number of surface polygons.

The directive Thickness applies to Lines. You can specify the thickness of mesh lines, polygon edges or boundary lines.

Applying Thickness to polygon edges using EdgeForm in PlotStyle:

ParametricPlot3D[Moebius[5, a, b], {a, -1, 1}, {b, 0, 2 Pi}, 
 ImageSize -> 500,
 Mesh -> None, MaxRecursion -> 0, PlotRange -> All,
 PlotPoints -> {5, 10},
 PlotStyle -> EdgeForm[{Red, Thickness[.005], Opacity[0.5]}]]
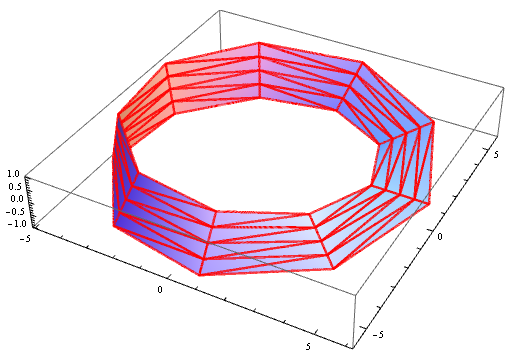
enter image description here

Applying Thickness to mesh lines using MeshStyle:

ParametricPlot3D[Moebius[5, a, b], {a, -1, 1}, {b, 0, 2 Pi}, 
 ImageSize -> 500,
 PlotPoints -> {20, 100}, MaxRecursion -> 0, PlotRange -> All,
 Mesh -> {5, 10}, MeshStyle -> {Directive[{Red, Thickness[.005]}], 
   Directive[{Blue, Thickness[.01]}]}]
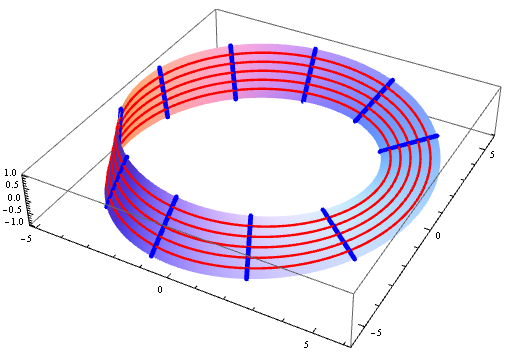
enter image description here

Applying Thickness to boundary lines using BoundaryStyle:

ParametricPlot3D[Moebius[5, a, b], {a, -1, 1}, {b, 0, 2 Pi},
 PlotPoints -> {20, 100}, MaxRecursion -> 0, PlotRange -> All, 
 Mesh -> None,  BoundaryStyle -> AbsoluteThickness[5], ImageSize -> 500]
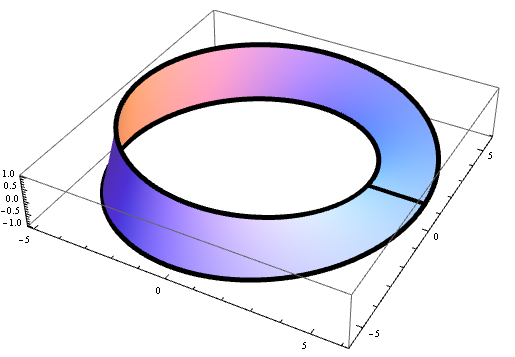
enter image description here

AbsoluteThickness versus Thickness:

Animate[Row[
  ParametricPlot3D[Moebius[5, a, b], {a, -1, 1}, {b, 0, 2 Pi}, 
     ImageSize -> t,
     PlotPoints -> {20, 100}, MaxRecursion -> 0, PlotRange -> All, 
     Mesh -> None, Axes -> False, Boxed -> False,
     PerformanceGoal -> "Quality", PlotLabel -> Style[#, 14, "Panel"],
     BoundaryStyle -> Directive[{Red, #}]] & /@ {AbsoluteThickness[3],
     Thickness[.01]}, Spacer[5]],
 {t, {150, 300,600}},  Paneled -> False]
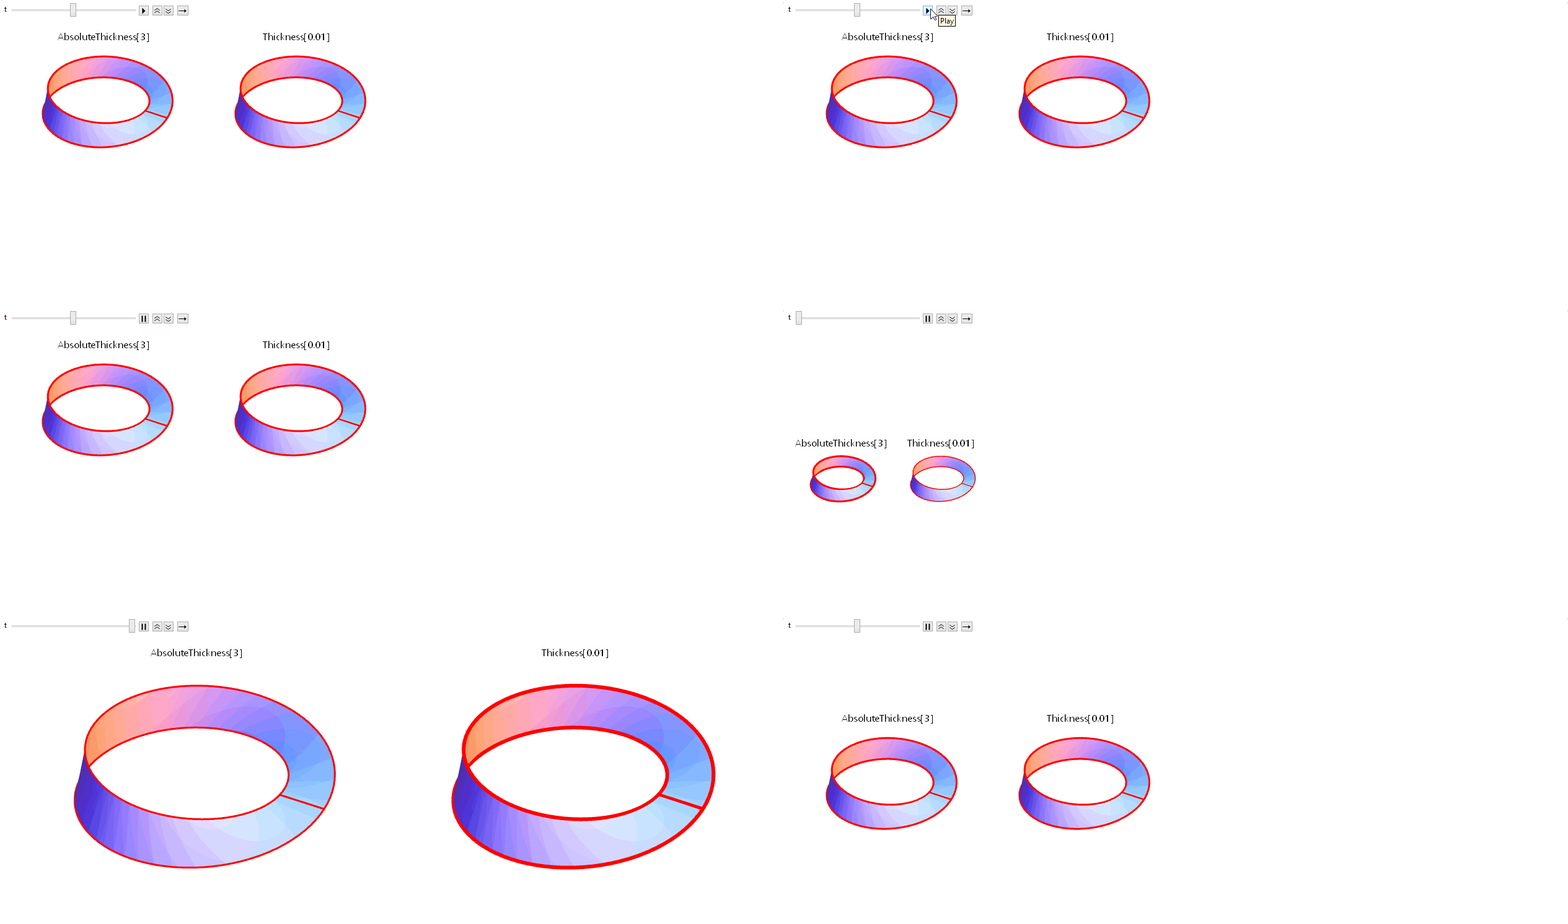
enter image description here

$\endgroup$
4
  • $\begingroup$ So what is horizontal plot range in 3d case? $\endgroup$
    – Kuba
    Commented Nov 10, 2014 at 13:35
  • $\begingroup$ @Kuba, good question. Probably the the range of the first axes; but ... your guess is as good as mine:) $\endgroup$
    – kglr
    Commented Nov 10, 2014 at 14:59
  • $\begingroup$ @kguler Thanks for the detailed response. It appears that a thickness specification in ParametricPlot3D is absolute, i.e. Thickness[2] yields a thickness of 2 units. So, in the following example, you can see that the thickness of 0.5 at x=y=-2 corresponds to the distance between the horizontal lines drawn 0.5 units apart. Show[ParametricPlot3D[{{x, y, (2*x*y)/(x^2 + y^2)},}, {x, -2, 2}, {y, -2, 2}, PlotStyle -> Thickness[0.5]], ParametricPlot3D[{x, -2, 1.25}, {x, -2, 2}], ParametricPlot3D[{x, -2, 0.75}, {x, -2, 2}]] $\endgroup$
    – Russell
    Commented Nov 12, 2014 at 5:29
  • $\begingroup$ Russell, actually, i think, your example shows that thickness is not absolute, because "it is not independent of the image size". The absolute thickness is measured in units of printer's points and it does not change when you resize the image. $\endgroup$
    – kglr
    Commented Nov 12, 2014 at 6:00

Your Answer

By clicking “Post Your Answer”, you agree to our terms of service and acknowledge you have read our privacy policy.

Not the answer you're looking for? Browse other questions tagged or ask your own question.