27
$\begingroup$

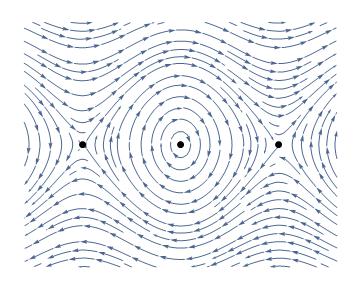
It is very nice and very easy to make a sketch of a phase portrait with StreamPlot. For example, for the classical pendulum, defined by

\begin{eqnarray*} \dot x&=&y,\\ \dot y&=&-\sin x, \end{eqnarray*}

The code

StreamPlot[{y, -Sin[x]}, {x, -5, 5}, {y, -3, 3}, 
  Frame -> None, StreamPoints -> Fine, AspectRatio -> 0.8,
  Epilog -> {PointSize -> Large, Point[{{0, 0}, {\[Pi], 0}, {-\[Pi], 0}}]}]

produces
enter image description here

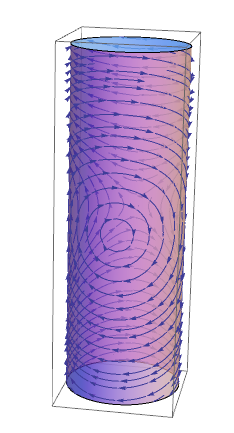
Now to the question. The actual phase space for the pendulum is not the plane $\mathbf R^2$, but the cylinder $\mathbf S^1\times \mathbf R$, and the pendulum of course has only two equilibria, one at $(0,0)$ and another one at $(\pi,0)$. Actually two points in the graph, the left and the right ones, are the same equilibrium.

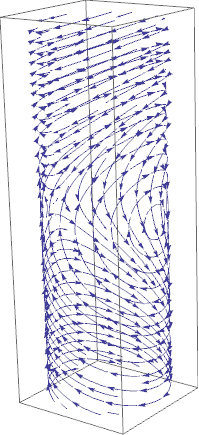
Question: How in Mathematica I can efficiently plot my phase portrait on a cylinder, such that I have only two equilibria, and I could see through the whole cylinder (I found examples on the site how to put a texture on a cylinder, but cannot figure out how to make it transparent).

$\endgroup$
1

2 Answers 2

32
$\begingroup$
plot = StreamPlot[{y, -Sin[x]}, {x, -Pi, Pi}, {y, -3, 3},  Frame -> None,  
          Epilog -> {PointSize -> Large, Point[{{0, 0}, {π, 0}, {-π, 0}}]}, 
          StreamPoints -> Fine,  AspectRatio -> 0.8]

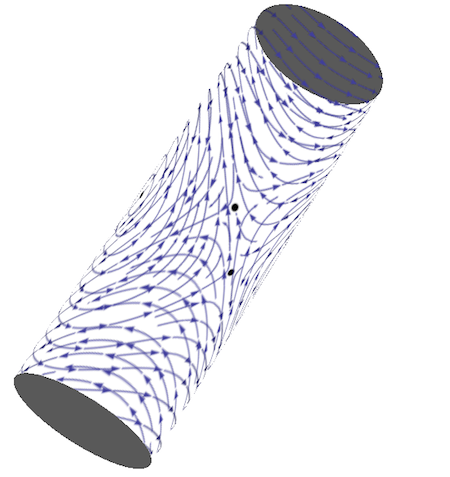
Try this:

First[Normal@plot] /.  a_Arrow :> (
                        a /. {x_Real, y_Real} :> {Cos[x], Sin[x], y}
                                  ) // Graphics3D

enter image description here

You can add Cylinder if you want:

Show[ %, 
      Graphics3D@{[email protected], LightBlue, Cylinder[{{0, 0, -3}, {0, 0, 3}}]}
    ]

enter image description here

$\endgroup$
3
  • 1
    $\begingroup$ (+1) I think it looks better with the cylinder added, though... $\endgroup$
    – Jens
    Commented Oct 29, 2014 at 15:33
  • $\begingroup$ @Jens You are right, I just wanted to fulfill question about transparency :) $\endgroup$
    – Kuba
    Commented Oct 29, 2014 at 17:32
  • $\begingroup$ Thank you, this is exactly I was looking for. $\endgroup$
    – Artem
    Commented Oct 30, 2014 at 22:18
19
$\begingroup$

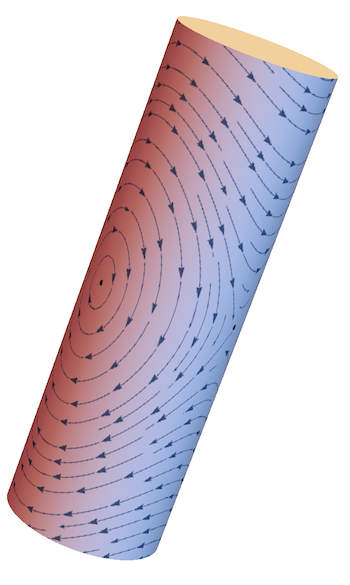
You could use an image representation of the plot and map it onto the modified cylinder that I defined in the answer linked here.

Just copy the definition of cyl from that answer, which includes the ability to add textures as follows:

img = Image@StreamPlot[{y, -Sin[x]}, {x, -5, 5}, {y, -3, 3},
    Frame -> None,
    PlotRange -> {{-5, 5}, {-3, 3}}, 
    Epilog -> {PointSize -> Large, 
      Point[{{0, 0}, {Pi, 0}, {-Pi, 0}}]}, StreamPoints -> Fine,
     AspectRatio -> 0.8, PlotRangePadding -> 0, ImageMargins -> 0,
    ImageSize -> 800];

Graphics3D[{Texture[img], EdgeForm[], 
  cyl[{{0, 0, 0}, {0, 0, 2 Pi}}, 1]}, Boxed -> False]

cyl

The resolution is controlled by the options of Image or by the ImageSize options in StreamPlot.

I also added the PlotRange to the original plot to suppress the plot range padding.

Edit

To make the whole thing transparent, you can use the same approach provided that the image has an alpha channel with transparent background:

img = Rasterize[
   StreamPlot[{y, -Sin[x]}, {x, -5, 5}, {y, -3, 3}, Frame -> None, 
    PlotRange -> {{-5, 5}, {-3, 3}}, 
    Epilog -> {PointSize -> Large, 
      Point[{{0, 0}, {Pi, 0}, {-Pi, 0}}]}, StreamPoints -> Fine, 
    AspectRatio -> 0.8, PlotRangePadding -> 0, ImageMargins -> 0, 
    ImageSize -> 500], Background -> None, ImageResolution -> 300
   ];

Graphics3D[{Texture[ImageData@img], EdgeForm[], 
  cyl[{{0, 0, 0}, {0, 0, 2 Pi}}, 1]}, Boxed -> False, 
 Lighting -> "Neutral"]

trasnp

Here I used Rasterize because it permits a Background -> None option. Also, I used ImageResolution in combination with the ImageSize specification of the StreamPlot to make sure that the Points from the Epilog in the original plot are properly visible.

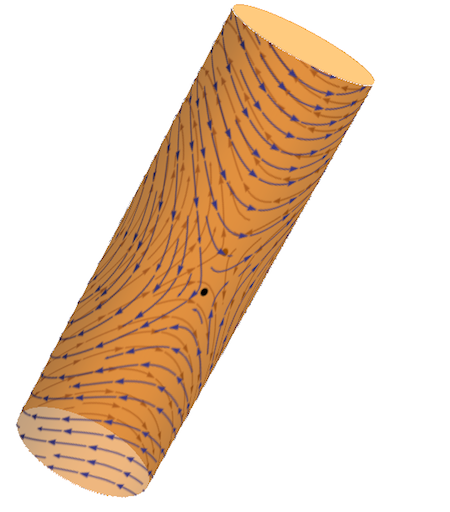
To combine transparency with a cylinder "backbone" for better visibility, you could do it like this:

Graphics3D[{Texture[ImageData@img], EdgeForm[], 
  cyl[{{0, 0, 0}, {0, 0, 2 Pi}}, 1], 
  FaceForm[Directive[Opacity[.5], Orange]], 
  Cylinder[{{0, 0, -.01}, {0, 0, 2 Pi + .01}}, .99]}, Boxed -> False, 
 Lighting -> "Neutral"]

backbone

$\endgroup$
2
  • $\begingroup$ Are you sure this answers the question ("I found examples on the site how to put a texture on a cylinder, but cannot figure out how to make it transparent")? $\endgroup$
    – user484
    Commented Oct 29, 2014 at 16:28
  • $\begingroup$ One could add an alpha channel: img2 = Image[ImageData[img] /. {{1., 1., 1.} -> {1., 1., 1., 0.5}, {r_, g_, b_} :> {r, g, b, 1.}}, ColorSpace -> "RGB"]. (Top & bottom stay solid, though.) But I agree with your other comment. The way it is is easier to see. $\endgroup$
    – Michael E2
    Commented Oct 29, 2014 at 16:55

Your Answer

By clicking “Post Your Answer”, you agree to our terms of service and acknowledge you have read our privacy policy.

Not the answer you're looking for? Browse other questions tagged or ask your own question.