Context
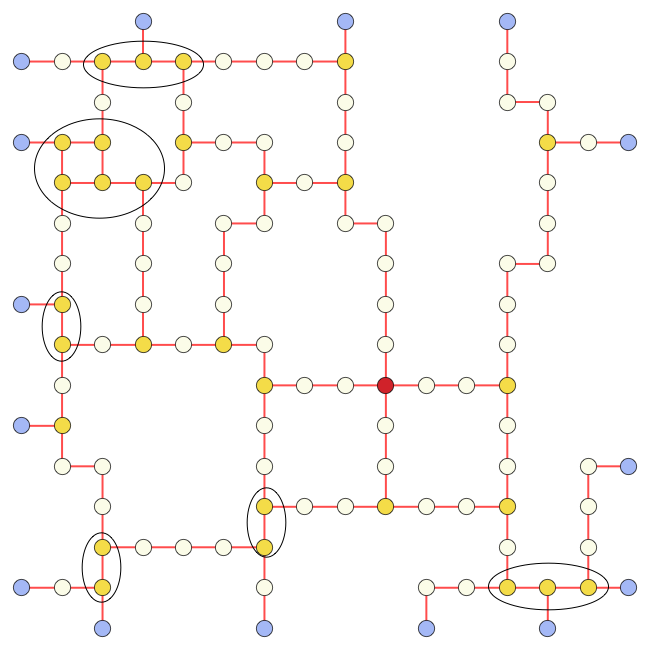
Given a Graph such as the one produced with the following code
 u = GaussianRandomField[n = 16, 2, Function[k, 1/k^2 Exp[-1/40 k^2]]] // Chop;
 skl = Map[If[# == 0, 1, 0] &, u // Image // WatershedComponents, {2}] // SparseArray;
 skl2 = arrayGraph[Normal@skl, VertexSize -> 0.4, EdgeStyle -> Directive[Thick, Red]];
 HighlighVertexDegree[skl2, VertexDegree[skl2]]
which is available here

Question
I would like
- to merge all groups of two (or more) yellow vertices by one single vertex which should have as a position their center of mass (I have highlighted them with ellipses by hand on this example).
For this second goal (which I should have posted as an independent question) the idea would be to write a function, say, SmoothGraph so that when given a graph, would return
the same graph but with VertexCoordinates modified for all the light yellow points so as to provide a smoother version.
PS: The yellow vertices are those which vertex degree is equal to two.
PS: these are the codes I used to produce the above graph
   arrayGraph[mat_, opts : OptionsPattern[]] :=
  Module[{m = Module[{i = 1}, mat /. 1 :> i++], edges, vcs, v},
  v = ComponentMeasurements[m, "Label"][[All, 1]];
  vcs = ComponentMeasurements[m, "Centroid", CornerNeighbors -> False];
  edges = UndirectedEdge @@@
  DeleteDuplicates[
  Sort /@ Flatten[Thread /@  ComponentMeasurements[m, "Neighbors",
     CornerNeighbors -> False]]];
  Graph[v, edges, VertexCoordinates -> vcs, opts]]

  HighlighVertexDegree[g_, vd_] :=
  HighlightGraph[g,
  Table[Style[VertexList[g][[i]],
  ColorData["TemperatureMap"][vd[[i]]/Max[vd]]], {i, VertexCount[g]}]];


  GaussianRandomField[size : (_Integer?Positive) : 256, dim : (_Integer?Positive) : 2,
                    Pk_: Function[k, k^-3]] := Module[{Pkn, fftIndgen, noise, amplitude, s2},
  Pkn = Compile[{{vec, _Real, 1}}, With[{nrm = Norm[vec]},
                                        If[nrm == 0, 0, Sqrt[Pk[nrm]]]],
                CompilationOptions -> {"InlineExternalDefinitions" -> True}];
  s2 = Quotient[size, 2];
  fftIndgen = ArrayPad[Range[0, s2], {0, s2 - 1}, "ReflectedNegation"];
  noise = Fourier[RandomVariate[NormalDistribution[], ConstantArray[size, dim]]];
  amplitude = Outer[Pkn[{##}] &, Sequence @@ ConstantArray[N @ fftIndgen, dim]];
  InverseFourier[noise * amplitude]]
Attempt
Following @Öskå advice I computed the candidates vertices as follows
 cand = EdgeList[skl2, # <-> _] & /@
 Flatten[(Position[VertexDegree[skl2], 3])];
 cand2 = Flatten[cand /. UndirectedEdge[a_, b_] -> {a, b}] // Sort;
 cand3 = First /@ Select[Tally[cand2], #[[2]] > 3 &]
(* {6,7,8,20,21,29,30,31,51,56,85,93,97,102,106,107,108} *)
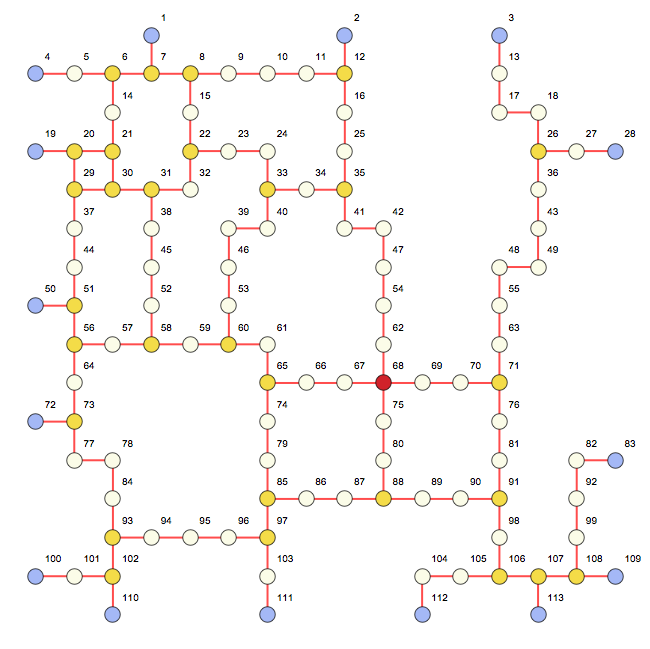
Indeed we can check they are correctly identified
  skl4 = HighlighVertexDegree[skl2, VertexDegree[skl2]];
  skl4=Graph[skl4, VertexLabels -> "Name"]


VertexInComponent[g, yourVertex, 1]$\endgroup$