3
$\begingroup$

I have one combined data with first number as the x-value and the remaining as different y-axis values (y1,y2,y3...). How do I break this combined list, data= (x,y1,y2,y3...) into smaller lists, such that data1=(x,y1), data2=(x,y2), data3=(x,y3) and so on. A sample data is provided below. There are 13 different y-values corresponding to each x-value (0.020024338, etc)

data = {{0.020024338, 0.46718468, 0.47932421, 0.4963509, 0.54065813, 
   0.65672949, 0.90251868, 1.3993448, 2.0366537, 2.7787049, 3.5291491,
    4.1795025, 4.7176233, 5.2050893}, {0.022380134, 0.46261264, 
   0.47904547, 0.48048812, 0.53233204, 0.63802768, 0.87323611, 
   1.2855847, 1.8349797, 2.4843739, 3.0854011, 3.6431969, 4.0993234, 
   4.5086694}, {0.024735928, 0.46659667, 0.47086932, 0.48182777, 
   0.53003113, 0.60881906, 0.82828889, 1.1792591, 1.6458275, 
   2.1951179, 2.7178107, 3.1922793, 3.6018543, 
   3.9553359}, {0.027091718, 0.46147435, 0.4661452, 0.47106584, 
   0.51119942, 0.58587206, 0.77147002, 1.0795141, 1.5085768, 
   1.9689408, 2.4348231, 2.8437078, 3.2039729, 
   3.5031466}, {0.029447506, 0.45854677, 0.46537594, 0.4661371, 
   0.50055295, 0.57566797, 0.72922597, 1.006301, 1.3908136, 1.8015069,
    2.2057531, 2.5789405, 2.8856884, 3.136435}, {0.031803289, 
   0.45134029, 0.45601075, 0.46374043, 0.49128087, 0.55187622, 
   0.69920774, 0.95526727, 1.2911787, 1.6753659, 2.0387226, 2.3660197,
    2.6352631, 2.8969679}, {0.034159069, 0.44936824, 0.45563798, 
   0.46621482, 0.48637763, 0.54613861, 0.68024646, 0.91613335, 
   1.2340513, 1.5942974, 1.92385, 2.2354871, 2.5057308, 2.720232}}
$\endgroup$

3 Answers 3

6
$\begingroup$

Here is one way to accomplish this:

op = data[[All, {1, #}]] & /@ Range[2, Length@data[[1]]];

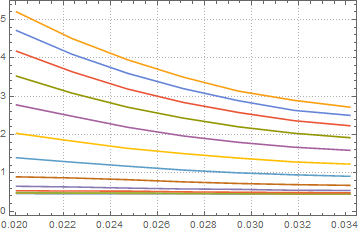
Visualize:

ListLinePlot[op, PlotTheme -> "Detailed"]

Mathematica graphics

You can collect them in different variables as follows:

Evaluate[Symbol /@ ("data" <> ToString[#] & /@ Range@Length@op)] = op;

Now: data1 gives

{{0.020024338, 0.46718468}, {0.022380134, 0.46261264}, {0.024735928, 0.46659667},
 {0.027091718, 0.46147435}, {0.029447506, 0.45854677}, {0.031803289, 0.45134029}, 
 {0.034159069, 0.44936824}}
$\endgroup$
6
  • $\begingroup$ @thils, Can you confirm if this is what you want? $\endgroup$
    – RunnyKine
    Commented Sep 2, 2014 at 0:55
  • $\begingroup$ I am not after the combined plot, the output required is of the form: data1={{x1,y11},{x2,y12},{x3,y13}...}; data2={{x1,y21},{x2,y22},{x3,y23}...} and so on. This will allow me to determine parameters associated with each data_i, I=1..13 $\endgroup$
    – thils
    Commented Sep 2, 2014 at 1:10
  • $\begingroup$ @thils That's what is stored in op isn't it? $\endgroup$
    – RunnyKine
    Commented Sep 2, 2014 at 1:14
  • $\begingroup$ @thils, you need to be clear in your question. I'm not sure what you really want. $\endgroup$
    – RunnyKine
    Commented Sep 2, 2014 at 1:16
  • 5
    $\begingroup$ @thils, you can just do data1 = op[[1]], data2 = op[[2]] etc. $\endgroup$
    – RunnyKine
    Commented Sep 2, 2014 at 1:24
4
$\begingroup$

Here's another somewhat shorter method:

Thread @ {#, {##2}} & @@@ data\[Transpose]

And this may be somewhat faster than other methods:

Inner[List, data[[All, 1]], data[[All, 2 ;;]], List]
$\endgroup$
1
  • $\begingroup$ Inner always amazes me. $\endgroup$
    – PhilChang
    Commented Sep 3, 2014 at 5:58
0
$\begingroup$

For instance, data1 and data13 can be obtained using

 x = data[[All, 1]];

    data1 = Transpose[Sort[MapThread[
           Function[xpt, {xpt, #} & /@ #2][#1] &, {x, Rest /@ data}]]][[1]] // TableForm

    data13 = Transpose[Sort[MapThread[Function[xpt, {xpt, #} & /@ #2][#1] &, {x, Rest /@ data}]]][[13]] // TableForm
$\endgroup$

Your Answer

By clicking “Post Your Answer”, you agree to our terms of service and acknowledge you have read our privacy policy.

Not the answer you're looking for? Browse other questions tagged or ask your own question.