15
$\begingroup$

One of the requirements set for the graphing project I am working on is that plot and axis unit labels sometimes need to include superscripts. Here is an approximately minimal example (I have some plotting options set differently from the default, but these shouldn't matter here):

fakedata101 = 
  FoldList[0.92 #1 + #2 &, 0., 
   RandomVariate[NormalDistribution[0, 0.5], 100]];
ListLinePlot[fakedata101, Filling -> Axis, PlotStyle ->Red, 
 FillingStyle -> Red, 
 PlotLabel -> "Test Label in k(\!\(\*SuperscriptBox[\(m\), \(2\)]\))"]
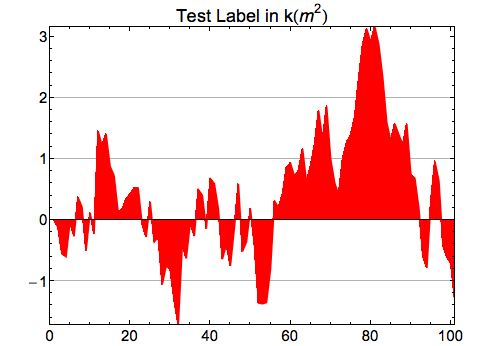
enter image description here

The SingleLetterItalics option appears to be turned off in the Options Inspector, but that doesn't seem to work for String-format text labels. It does work if set explicitly, e.g. when adding Text in an Epilog with an explicit Style wrapping:

Epilog -> 
 Text[Style["\!\(\*SuperscriptBox[\(Text with Footnote marker\), \((a)\)]\)", 
   SingleLetterItalics -> False], {10, -1.5}]

Is there a way I can robustly turn off SingleLetterItalics in styled text such as this? I would prefer not to have to catch every String passed to a PlotLabel or AxisLabel and send it through a Style command if I could help it.

$\endgroup$
8
  • 2
    $\begingroup$ What I personally do to avoid this is the following: before entering a math-expression, I open a new subcell by pressing Ctrl-9. Then I type $m^2$. Then I select m and press Ctrl-I to make the italic into upright type. The input for of what I get is "k (\!\(\*Cell[TextData[Cell[BoxData[\nFormBox[\n\n \ SuperscriptBox[\nStyleBox[\"m\",\nFontSlant->\"Plain\"], \"2\"], \n \ TraditionalForm]],\nFormatType->\"TraditionalForm\"]]]\))" I know it looks awful here, just paste it back into a notebook and 'evaluate' it to see what it looks like. Move the cursor on m to see the subcell. $\endgroup$
    – Szabolcs
    Commented May 13, 2012 at 12:38
  • $\begingroup$ A related question is "Fixing quirky typesetting in plot labels". In my answer there, I describe the "interactive" method similar to what @Szabolcs mentions above, which works without problem for your plot labels. $\endgroup$
    – Jens
    Commented May 13, 2012 at 16:00
  • $\begingroup$ By the way, I still think this is an interesting question because it points to the rather byzantine methods one has to use to achieve a seemingly simple option setting, see the answer by @Mr.Wizard. $\endgroup$
    – Jens
    Commented May 13, 2012 at 16:04
  • $\begingroup$ One consideration I should have mentioned is that this is a graphing package that is to be used by many other people not familiar with Mathematica. So I'd like to ensure that users don't have to insert labels "the exact right" (and perhaps a bit convoluted) way. $\endgroup$
    – Verbeia
    Commented May 13, 2012 at 20:34
  • $\begingroup$ @Verbeia: your last comment is of course an important little detail, which will probably make my answer useless :-). How are these users supposed to provide the input, then? Possible solutions will depend on that, I think... $\endgroup$ Commented May 13, 2012 at 20:55

4 Answers 4

14
$\begingroup$

I don't know if it qualifies as an answer to your question if I suggest to change the structure of the labeling in the first place. As you write it, the m is -- from the rendering point of view -- treated as a symbol, if you inclose it with quotation marks it will be treated as a string and no auto-italic is performed at all. E.g.:

PlotLabel -> "Test Label in k(\!\(\*SuperscriptBox[\(\"m\"\), \\(2\)]\))"

instead of

PlotLabel -> "Test Label in k(\!\(\*SuperscriptBox[\(m\), \(2\)]\))"

another thing you should be aware of is that you can use arbitrary expressions as labels, e.g.:

PlotLabel -> Row[{"Test Label in k(", Superscript["m", 2], ")"}]

which I find much easier to automatically create and manipulate as well as manually maintain than those cryptic strings...

If, as your comments suggest, you don't have control over how these labels are created, the following could be the solution you are after:

ListLinePlot[fakedata101, Filling -> Axis, PlotStyle -> Red, 
  FillingStyle -> Red, 
  PlotLabel -> "Test Label in k(\!\(\*SuperscriptBox[\(m\), \(2\)]\))",
  FormatType -> (Style[TraditionalForm[##],SingleLetterItalics -> False] &)
]
$\endgroup$
1
  • $\begingroup$ My problem was the "J" in an OverDot[J] being italicized in a FrameLabel. The second solution, PlotLabel -> Row[{"Test Label in k(", Superscript["m", 2], ")"}], is the only thing that worked for me. Answers by others seemed to work until export to PDF, then the "J" would again be italicized. Thanks for your answer! $\endgroup$
    – ndetermin
    Commented Jun 14, 2016 at 16:04
10
$\begingroup$

It's in the style sheet. Use a custom style sheet to override the default.

Format > Edit Stylesheet... then enter style name: TraditionalForm

Open Format > Option Inspector... and set SingleLetterItalics to False

$\endgroup$
3
  • $\begingroup$ This works perfectly, but setting the FormatType option is something I can do in the package, rather than making everyone use a particular stylesheet for their notebooks. $\endgroup$
    – Verbeia
    Commented May 13, 2012 at 22:15
  • 1
    $\begingroup$ Note to open the Option Inspector from the Format menu, not the Preferences dialog. Also have the TraditionalForm cell highlighted beforehand. The cell can also be manually edited using Control-Shift-E. $\endgroup$ Commented Jun 2, 2012 at 18:30
  • $\begingroup$ @Chris thanks for the note. I updated the answer to include at least part of that, and upvoted the comment for visibility. $\endgroup$
    – Mr.Wizard
    Commented Jun 2, 2012 at 21:30
1
$\begingroup$

Having set the notebook style definition as described in Mr.Wizard's answer, the value can be obtained and applied to new notebooks programmatically.

I.e. In a manually style-edited notebook obtain the style definition:

newstyle = StyleDefinitions /. Options[SelectedNotebook[]]

Notebook[{Cell[StyleData[StyleDefinitions -> "Default.nb"]], Cell[StyleData["TraditionalForm"], SingleLetterItalics -> False, MenuSortingValue -> 10000]}, Visible -> False, FrontEndVersion -> "8.0 for Microsoft Windows (32-bit) (February 23, 2011)", StyleDefinitions -> "PrivateStylesheetFormatting.nb"]

This can then be applied in a new notebook, (possibly as part of a called function):

SetOptions[SelectedNotebook[], StyleDefinitions -> newstyle]
$\endgroup$
1
$\begingroup$

A problem with the given solutions exists at least in version 7.0.1 on Win7, (but not in version 8), in that a space is added to a string when Inset is used.

Starting with the default format this text appears in italics, with an extra space:

ab = Graphics[{{Yellow, Rectangle[{0, 0}, {1, 0.5}]}, 
   Inset["A&B", {0.5, 0.25}]}, AspectRatio -> 0.5, 
  PlotRange -> {{0, 1}, {0, 0.5}}, ImageSize -> 50, 
  BaseStyle -> {FontSize -> 14}]

enter image description here

Editing the style sheet's TraditionalForm or applying this solution clears the italics but leaves the space:

Append[ab, 
 FormatType -> (Style[TraditionalForm[##], 
     SingleLetterItalics -> False] &)]

enter image description here

This is my current blunderbuss solution:

(ab[[Sequence @@ #]] = 
    Style[ab[[Sequence @@ #]], SingleLetterItalics -> False]) & /@ 
 Complement[Position[ab, _String], 
  Append[#, 1] & /@ Position[ab, _Style]]; ab

enter image description here

And a solution suggested by Heike, to eschew use of Inset:

Graphics[{{Yellow, Rectangle[{0, 0}, {1, 0.5}]}, 
  Text["A&B", {0.5, 0.25}]}, AspectRatio -> 0.5, 
 PlotRange -> {{0, 1}, {0, 0.5}}, ImageSize -> 50, 
 BaseStyle -> {FontSize -> 14}]

enter image description here

(However, the graphics I have to modify already have extensive use of Inset.)

$\endgroup$

Your Answer

By clicking “Post Your Answer”, you agree to our terms of service and acknowledge you have read our privacy policy.

Not the answer you're looking for? Browse other questions tagged or ask your own question.