0
$\begingroup$

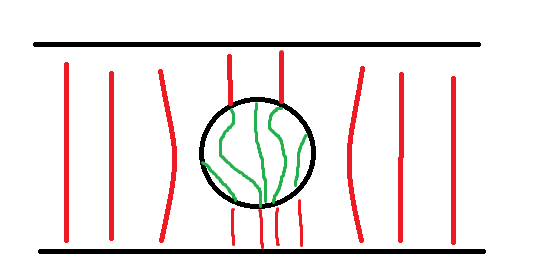
I have attached a scheme of the problem. Essentially what I need is to plot 2 different vector fields in a single graph with different domains.

The underlying physical problem is to model electric current around and inside a sphere of a different material than the surroundings.
enter image description here

Thanks

$\endgroup$
0

1 Answer 1

1
$\begingroup$
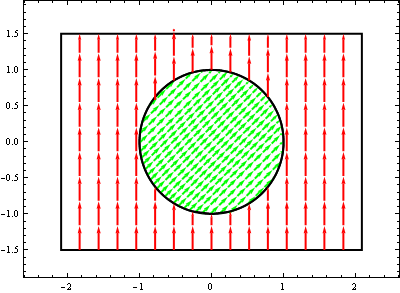
Show[
 StreamPlot[{1, 1}, {x, -1, 1}, {y, -1, 1}, RegionFunction -> (Norm[{#, #2}] < 1 &),   
                                BoundaryStyle -> Thick, StreamStyle -> {Thick, Green}],
 StreamPlot[{0, 1}, {x, -2, 2}, {y, -2, 2}, StreamStyle -> {Thick, Red},
                               RegionFunction -> (Abs[#2] < 1.5 && Norm[{#, #2}] > 1 &),  
                               BoundaryStyle -> Thick, 
  , PlotRange -> All, AspectRatio -> Automatic, PlotRangePadding -> [email protected]]

enter image description here

$\endgroup$
2
  • $\begingroup$ Apparently you found the question :P $\endgroup$
    – Öskå
    Commented May 21, 2014 at 9:40
  • $\begingroup$ @Öskå blind shot :p $\endgroup$
    – Kuba
    Commented May 21, 2014 at 9:43

Your Answer

By clicking “Post Your Answer”, you agree to our terms of service and acknowledge you have read our privacy policy.

Not the answer you're looking for? Browse other questions tagged or ask your own question.