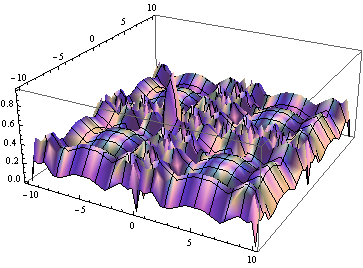
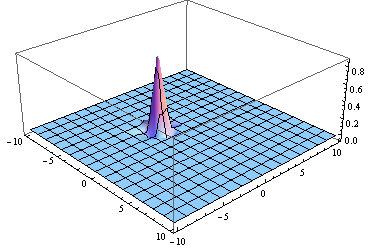
This question arose in response to a comment by Leonid to my answer for this question. He noted that for unstructured grids, Interpolation can only use InterpolationOrder->1. For example:
data = Flatten[Table[{x, y, x^2 + y^2}, {x, -10, 10}, {y, -10, 10}], 1];
dataDelete = Delete[data, RandomInteger[{1, Length[data]}]]
intD = Interpolation[dataDelete]
(* Interpolation::udeg: Interpolation on unstructured grids is currently only supported for InterpolationOrder->1 or InterpolationOrder->All. Order will be reduced to 1. *)
which gives a result much worse than All-order Interpolation. So, here's my question:
For data that is largely structured, but is missing one (or a few?) grid points, is there any way to figure out where the grid is missing points? This would allow you to first use linear interpolation to find a good guess for the value of the function at the missing grid points, then add that grid point to the dataset, only to interpolate the whole thing after. Then the error in the interpolation will be localized to the reconstructed region. Something like
dataReconstructed=Append[dataDelete,Sequence @@ Flatten@{#, intD @@ #} & /@missingcoords]
intReconstructed = Interpolation[dataReconstructed]
A manual example:
todelete = RandomInteger[{1, Length[data]}];
dataDelete = Delete[data, todelete];
intD = Interpolation[dataDelete]
missingcoords = {data[[todelete, {1, 2}]]}

dataReconstructed = Append[dataDelete,Sequence @@ Flatten@{#, intD @@ #} & /@missingcoords]
intReconstructed = Interpolation[dataReconstructed]
Comparing these two methods using exact[x_, y_] := x^2 + y^2:
Plot3D[intD[x, y] - exact[x, y], {x, -10, 10}, {y, -10, 10}]

has differences all over the interpolated region, worse at the missing point. But:
Plot3D[intReconstructed[x, y] - exact[x, y], {x, -10, 10}, {y, -10, 10}]

is much better everywhere except for the missing points.
In order to do this for a set where I don't know which grid points are missing, is there a way to figure out where the missing grid points are in a mostly structured grid?
