I have a list of numbers and I want to plot the fraction of numbers >= k against k which will naturally be a decreasing curve. How do I do that?
3 Answers
E.g.:
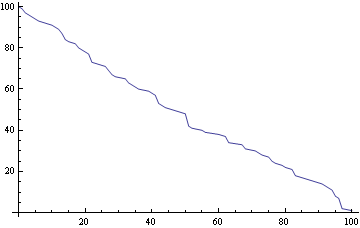
test = RandomInteger[100, 100];

ListLinePlot[With[{r = Reverse@Sort@Tally[test]},
  Transpose[{Reverse@r[[All, 1]], Reverse@Accumulate@r[[All, 2]]}]]]

You mean something like this?
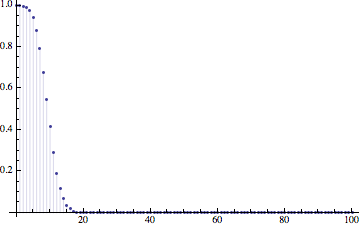
list = RandomVariate[BinomialDistribution[100, 0.1], {10000}];
You can use list to construct an EmpiricalDistribution, and then use DiscretePlot (if the list is all integers) or Plot (if it's reals) to plot the complement of its CDF.
dist = EmpiricalDistribution[list];

DiscretePlot[1 - CDF[dist, x], {x, 0, 100}, PlotRange -> All]

Few more alternatives/variations:
data = RandomReal[50, 100];
HistogramListwith height spec"SF":ListLinePlot[#, PlotRange -> {{0, 60}, Automatic}]&@Thread@PadRight@HistogramList[data, 1000, "SF"]SurvivalFunctionandEmpiricialDistributionPlot[SurvivalFunction[EmpiricalDistribution[data], x], {x, 0, 60}, Exclusions -> None]Plain old
Histogramwith height spec"SF"Histogram[data, 1000, "SF", PlotRange -> {{0, 60}, Automatic}];

