3
$\begingroup$

I'm trying to plot on a single axes system multiple graphs but ran into a problem when tryinf to label my graphs. Here's what I've used so far

Mathematica code:

r1 = 0.5;
r2 = 1;
r3 = 2;
r4 = 2.5;
z[r_, t_] = {r ^2 Cos[2 t] - 2 r Sin[t], 2 r Cos[t] + r^2 Sin[2 t]};
zz[t_] = Table[z[r, t], {r, 0.1, 4, 0.5}];
ParametricPlot[{z[r1, t], z[r2, t], z[r3, t], z[r4, t]}, {t, 0, 
  2 \[Pi]}, PlotRange -> Full, PlotStyle -> {Thick}, 
 AxesLabel -> {"Re(z)", "Im(z)"}, 
 LabelStyle -> Directive[Bold, Large]]

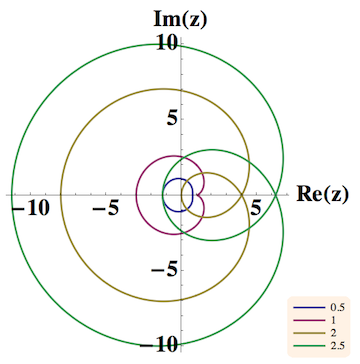
Now, I can't seem to get the legends show, I simply want a number next to each color, say, 0.5 - (green) etc..

Ideally I would like a more elegant solution than having to manually set r1,r2,...

Thanks!

$\endgroup$
1
  • $\begingroup$ I'm not sure what you are asking, is PlotLegends -> {r1, r2, r3, r4} what you are after? Or you want to put zz[t] into ParametricPlot but one color is used, then evaluation in Plot $\endgroup$
    – Kuba
    Commented Mar 11, 2014 at 17:33

2 Answers 2

4
$\begingroup$

In these cases I usually do the legend by hand (kind of like Kuba):

Module[{z, rmin = 0.1, rmax = 4, rstep = .5},
 z[r_, t_] := {r^2 Cos[2 t] - 2 r Sin[t], 2 r Cos[t] + r^2 Sin[2 t]};
 ParametricPlot[Evaluate@Table[z[r, t], {r, rmin, rmax, rstep}],
  {t, 0, 2 \[Pi]},
  PlotRange -> Full,
  PlotStyle -> {Thick},
  PlotLegends -> SwatchLegend[
    Table[ColorData[1][r], {r, 1, Ceiling[(rmax - rmin)/rstep]}], 
    Table[ToString@z[r, t], {r, rmin, rmax, rstep}]],
  AxesLabel -> {"Re(z)", "Im(z)"},
  LabelStyle -> Directive[Bold, Large]]
 ]

enter image description here

but if you have a version earlier than 8, Jens's is definitely the way to go - don't go anywhere near the plot legends package!

$\endgroup$
4
  • $\begingroup$ Thanks! This works well. Any chance to avoid two contours having the same color? $\endgroup$ Commented Mar 12, 2014 at 7:35
  • $\begingroup$ The plot thickens, how do I copy both the plot and the legends as a single graphic file? Through the use of palette and save as or is there any other more direct way? $\endgroup$ Commented Mar 12, 2014 at 7:44
  • $\begingroup$ That depends on where do you want to copy to. If another notebook, just copy the whole cell by selecting the cell bracket. If a pdf file, use Export. Or you can select/highlight the whole graphic and choose Edit -> Copy As -> BitMap/PDF. $\endgroup$ Commented Mar 12, 2014 at 16:03
  • 1
    $\begingroup$ Indexed ColorData 1 and 63 are infinite number of colors palette, meaning colors don't repeat. However, there is no guarantee to always get a nice distinguishable color set. $\endgroup$ Commented Mar 12, 2014 at 16:10
4
$\begingroup$

If you want legends, you may want to try the code I posted under Creating legends for plots with multiple lines?. To use it, copy all the definitions in the first code block of that answer, then re-create your plot this way:

z[r_, t_] = {r^2 Cos[2 t] - 2 r Sin[t], 2 r Cos[t] + r^2 Sin[2 t]};
zz[t_] = Table[z[r, t], {r, 0.1, 4, 0.5}];
p = ParametricPlot[Evaluate[
    Table[
     Tooltip[z[rr, t], rr],
     {rr, {.5, 1, 2, 2.5}}
     ]
    ],
   {t, 0, 2 Pi},
   PlotRange -> Full,
   PlotStyle -> {Thick}, AxesLabel -> {"Re(z)", "Im(z)"},
   LabelStyle -> Directive[Bold, Large]
   ];

autoLegend[
 p,
 Table[rr, {rr, {.5, 1, 2, 2.5}}],
 Background -> Directive[LightOrange, Opacity[.5]],
 Alignment -> {Right, Bottom},
 BaseStyle -> Larger
 ]

Legended

Here I also added a Tooltip for each line in your plot (that's optional, I just wanted to point out this alternative). You may want to play with the positioning and size of the legend. It is explained in the examples for autoLegend in the linked answer.

$\endgroup$

Your Answer

By clicking “Post Your Answer”, you agree to our terms of service and acknowledge you have read our privacy policy.

Not the answer you're looking for? Browse other questions tagged or ask your own question.