2
$\begingroup$

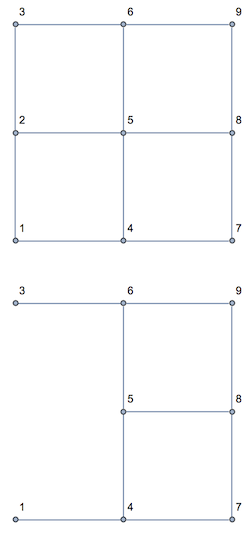
Take a simple GridGraph:

g = GridGraph[{3, 3}, VertexLabels -> "Name", ImageSize -> 150, ImagePadding -> 10]

g

I am puzzled by the following behavior:

Try to delete vertex 2:

h=VertexDelete[g, 2]

vd

Vertex 2 was deleted, but so were several edges that did not have a node at vertex 2. In addition, Vertex 1 appears to be connected to vertex 3; it wasn't before.

Now look at the remaining edges:

EdgeList[h]

{1 [UndirectedEdge] 4, 3 [UndirectedEdge] 6, 4 [UndirectedEdge] 5, 4 [UndirectedEdge] 7, 5 [UndirectedEdge] 6, 5 [UndirectedEdge] 8, 6 [UndirectedEdge] 9, 7 [UndirectedEdge] 8, 8 [UndirectedEdge] 9}

According to the edge list, Vertex 1 is not connected to vertex 3 (even though it was draw as connected to 3); but vertex 1 is connected to vertex 4 (even though it was not so drawn).


Try deleting vertices 1 and 3:

VertexDelete[g, {1, 3}]

vd2

Either I am misunderstanding something or Mathematica is erring. Can anyone explain which is the case?

Thanks.

$\endgroup$

3 Answers 3

5
$\begingroup$

Bill's explanation is good. I would also recommend preserving the original grid layout to see things clear:

g = GridGraph[{3, 3}, VertexLabels -> "Name", ImagePadding -> 15]
h = SetProperty[VertexDelete[g, #], VertexCoordinates -> Delete[GraphEmbedding[g], #]] &@2

enter image description here

$\endgroup$
4
  • $\begingroup$ Useful suggestion. I'm hoping to delete several vertices and then add some extra edges to the grid graph. Not sure how to proceed. $\endgroup$
    – DavidC
    Commented Jan 5, 2014 at 5:50
  • $\begingroup$ @David Related thread: Keeping vertexcoordinates after adding a new vertex $\endgroup$ Commented Jan 6, 2014 at 13:48
  • $\begingroup$ Thanks, István. The thread seems very useful. $\endgroup$
    – DavidC
    Commented Jan 6, 2014 at 13:54
  • $\begingroup$ I tested this on a graph, removal of many vertices and structure not preserved so problems: can you preview it here? Thank you in advance. $\endgroup$
    – hhh
    Commented Feb 1, 2016 at 11:06
4
$\begingroup$

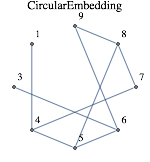
You can see what is going on by changing the arrangement of the vertices. Here is your g with a circular structure:

g = GridGraph[{3, 3}, VertexLabels -> "Name", ImageSize -> 150, 
    ImagePadding -> 10, GraphLayout -> "CircularEmbedding", 
    PlotLabel -> "CircularEmbedding"]

enter image description here

Now for the h:

h = VertexDelete[g, 2]

enter image description here

Now the picture more accurately reflects the structure you expect to see from the EdgeList. The problem is basically that the straight lines connecting 1 and 4 happen to pass through 3 in the default arrangement.

$\endgroup$
1
  • $\begingroup$ So, I was seeing an optical illusion! Thanks for clearing up the mystery. $\endgroup$
    – DavidC
    Commented Jan 5, 2014 at 5:36
1
$\begingroup$

More detailed explanation:

GridGraph produces a graph with GraphLayout property

g = GridGraph[{3, 3}, VertexLabels -> "Name", ImageSize -> 150, ImagePadding -> 10];
PropertyValue[g, GraphLayout]

{"GridEmbedding", "Dimension" -> {3, 3}}

VertexDelete conserved this property

h = VertexDelete[g, 2];
PropertyValue[h, GraphLayout]

{"GridEmbedding", "Dimension" -> {3, 3}}

However, now this embedding is incorrect. You can save vertex positions as in Vitaliy Kaurov's answer. Another method is deleting GraphLayout property:

SetProperty[h, GraphLayout -> Automatic]

enter image description here

$\endgroup$
0

Your Answer

By clicking “Post Your Answer”, you agree to our terms of service and acknowledge you have read our privacy policy.

Not the answer you're looking for? Browse other questions tagged or ask your own question.