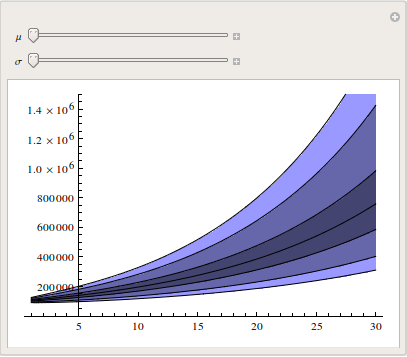
Following code plots Quantiles for a GBM process.
ranges = {.01, .05, .25, .5, .75, .95, .99};
Manipulate[
 Plot[
  Quantile[
    GeometricBrownianMotionProcess[μ, σ, 100000][t],ranges],
 {t, 1, 30},PlotRange -> {0, 1500000}],
{μ, .07, .1}, {σ, .07, .20}]
I would like to shade the area between the ranges
.01 to .05 and .95 to .99 say lt. blue .05 to .25 and .75 to .95 say med. blue .25 to .75 say dark blue with the .5 quantile line thick black
Plot options seems to allow filling between curves using
Filling->{{1}->2}
syntax but not sure how or if that can be applied here?

