6
$\begingroup$

I would like to plot a set of points in the same style as ListPlot3D does, but only in a non-convex region that I can specify (e.g. using a RegionFunction). Is there a simple solution for this?

Let me illustrate with an example.

Let's generate some sample points ...

Clear[regionFun]
regionFun[{x_, y_}] := y < x^2

fun[{x_, y_}] := -Norm[{x, y} - {.5, .5}]

pts = Select[Tuples[Range[0, 1, 0.01], 2], regionFun];

... and try to plot then in the region we're interested in:

ListPlot3D[
 Append[#, fun[#]] & /@ pts,
 RegionFunction -> Function[{x, y}, regionFun[{x, y}]],
 InterpolationOrder -> 1
]
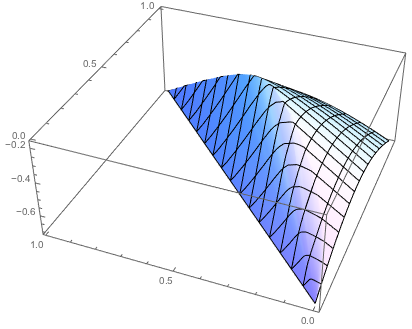
enter image description here

Notice that the plot occupies the complete convex hull of the points because of how the Delaunay triangulation was constructed for the interpolation.

What I would like to see instead is this:

Plot3D[fun[{x, y}], {x, 0, 1}, {y, 0, 1}, 
 RegionFunction -> Function[{x, y}, regionFun[{x, y}]]]
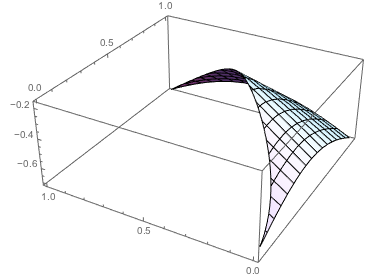
enter image description here

The only possible solution I see at the moment is to use an external tool to "manually" construct a Delaunay triangulation which is confined within a region and build the plot from that data. This, however, is a lot of work, so I thought I'd ask first if there's a simple solution.

Note that this is just a generated example dataset, not my real data. I can't use Plot3D for my real application, only ListPlot3D and related functions.

$\endgroup$
9
  • 2
    $\begingroup$ Interpolation + Plot3D works. $\endgroup$
    – rm -rf
    Commented Nov 10, 2013 at 20:55
  • $\begingroup$ @rm-rf For a arbitrary point cloud on an unstructured grid we will have to accept the Interpolation::udeg message too! Interpolationorder will be constrained to one. $\endgroup$ Commented Nov 10, 2013 at 21:24
  • $\begingroup$ @PlatoManiac Right, but Szabolcs used order 1 anyway, so that shouldn't be a problem here. Szabolcs, I don't understand why you said you don't get nice plots... with ifun = Interpolation[Append[#, fun[#]] & /@ pts, InterpolationOrder -> 1, "ExtrapolationHandler" -> {(Indeterminate &), "WarningMessage" -> False}]; and MaxRecursion -> 6, I get a plot that's as good as the native Plot3D. $\endgroup$
    – rm -rf
    Commented Nov 10, 2013 at 21:29
  • $\begingroup$ @PlatoManiac All built-in List* plotting functions that work on 2D data will only do linear interpolation for unstructured grids, so it's the same thing. $\endgroup$
    – Szabolcs
    Commented Nov 10, 2013 at 21:31
  • $\begingroup$ @rm-rf I also don't understand why I don't get nice plots for my real data, but I don't. This example I posted works perfectly. I guess my real data is nastier: dropbox.com/s/4xn79zcpnz81711/… Regardless, I'd accept your answer if you posted it as I'm using it now. (I did increase PlotPoints and MaxRecursion --- I think somehow the higher-than-order-1 adaptive sampler of Plot3D doesn't work well with the order-1 interpolation) $\endgroup$
    – Szabolcs
    Commented Nov 10, 2013 at 21:33

1 Answer 1

8
$\begingroup$

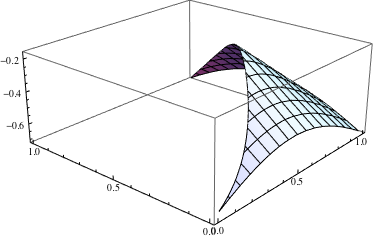
Using Interpolation with Plot3D and slightly increasing the MaxRecursion gives you a nice plot. Since you have an unstructured grid, the interpolation order will be restricted to 1.

ifun = Interpolation[Append[#, fun[#]] & /@ pts, InterpolationOrder -> 1, 
   "ExtrapolationHandler" -> {(Indeterminate &), "WarningMessage" -> False}];
Plot3D[ifun[x, y], {x, 0, 1}, {y, 0, 1}, MaxRecursion -> 6,
    RegionFunction -> Function[{x, y}, regionFun[{x, y}]]]

$\endgroup$

Your Answer

By clicking “Post Your Answer”, you agree to our terms of service and acknowledge you have read our privacy policy.

Not the answer you're looking for? Browse other questions tagged or ask your own question.