I'm doing a project trying to 3D print the stereographic projections of 4D shapes, and I need it so that the lines are thinner towards the origin for structural reasons. I've written functions to do the projection and to draw the projected line between two vertices, and this works fine for just lines:
f[{x_, y_, z_, w_}] := {x/(1 - w), y/(1 - w), z/(1 - w)} (*formula for stereographic projection*)

drawing[{{x1_, x2_, x3_, x4_}, {y1_, y2_, y3_, y4_}}] :=
 Module[{v1, v2, u}, v1 = {x1, x2, x3, x4}/2;
  v2 = {y1, y2, y3, y4}/2;
  u = v2 - v1;
  ParametricPlot3D[f[RotationMatrix[{v1, v1 + t*u}] . v1], {t, 0, 1}, PlotRange -> All]] (*this is drawing the geodesic on the unit 3-sphere and then projecting it to 3D*)
Which gives stuff like this:
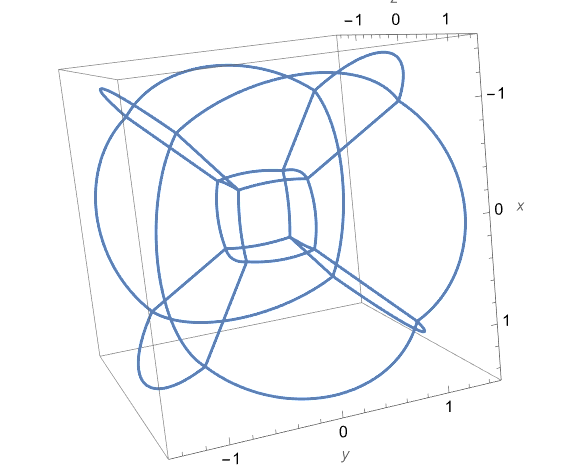 But just drawing the lines doesn't work for 3D printing, so I've tried lots of ways to continuously vary Tube radius but none quite work as I want.
My first try was /. Line[pts_] -> Tube[pts, 0.03 + Norm[pts]/100] at the end, which gives constant tube radius for each edge, but does change depending on the starting vertex, and annoyingly on which end of each edge you start at.
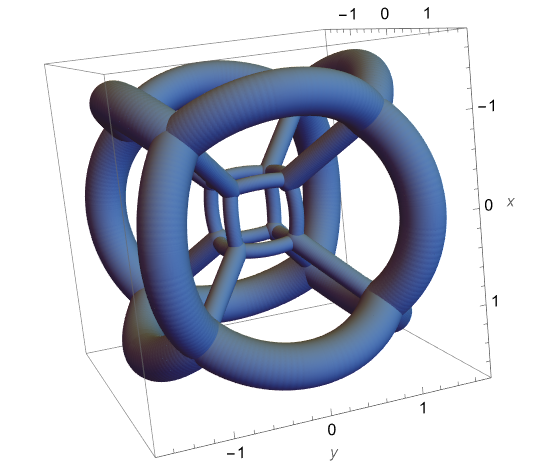
I realised it might work better if I made the radius function explicitly a function of t, but I got 1/0 errors unless I used an If statement to restrict t: PlotStyle -> Tube[If[0 <= t <= 1, 0.03 + Norm[f[RotationMatrix[{v1, v1 + t*u}] . v1]]/100, 0.03]]
But then for some reason the range of t needed to cover the entirety on an edge is much larger than 0<t<1 (more like 0<100, and also depends on which edge you're drawing), and the radius blows up for small t (like t<3).
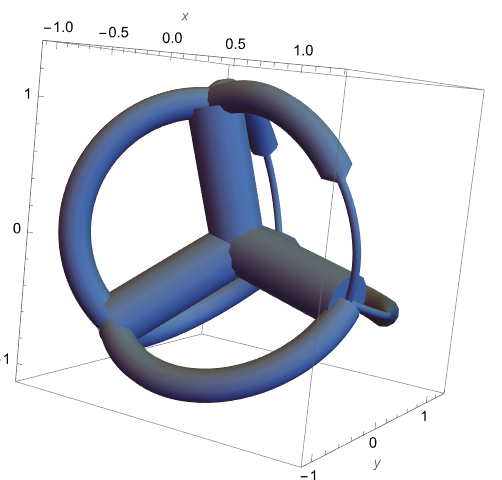
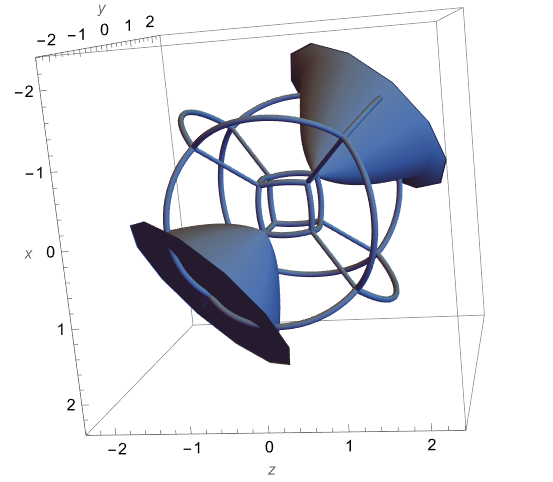 So my question is why is the range of t different when plotting versus in the tube radius function, and does anyone have any better suggestions for how to get what I want? (And also if there are more efficient ways of drawing stereographic projects in general?)
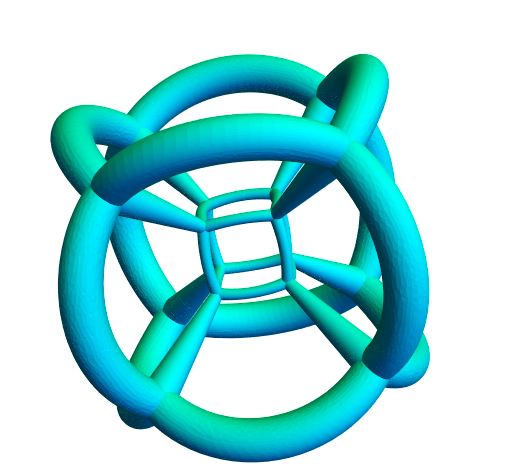
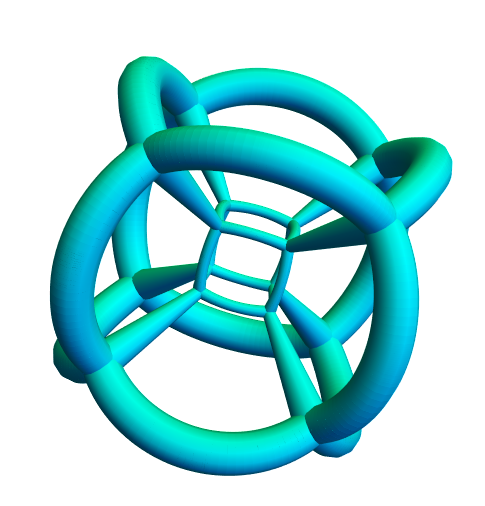
Hypercube:
Show[projection[#] & /@ {{{-1, -1, -1, 1}, {-1, -1, 1, 1}}, {{-1, -1, -1, 1}, {-1, 1, -1, 1}}, {{-1, -1, -1, 1}, {1, -1, -1, 1}}, {{-1, -1, -1, 1}, {-1, -1, -1, -1}},{{-1, -1, 1, 1}, {1, -1, 1, 1}}, {{-1, -1, 1, 1}, {-1, 1, 1, 1}}, {{-1, -1, 1, 1}, {-1, -1, 1, -1}},{{-1, 1, -1, 1}, {1, 1, -1, 1}}, {{-1, 1, -1, 1}, {-1, 1, 1, 1}}, {{-1, 1, -1, 1}, {-1, 1, -1, -1}},{{-1, 1, 1, 1}, {1, 1, 1, 1}}, {{-1, 1, 1, 1}, {-1, 1, 1, -1}},{{1, -1, -1, 1}, {-1, -1, -1, 1}}, {{1, -1, -1, 1}, {1, 1, -1, 1}}, {{1, -1, -1, 1}, {1, -1, 1, 1}}, {{1, -1, -1, 1}, {1, -1, -1, -1}},{{1, -1, 1, 1}, {1, 1, 1, 1}}, {{1, -1, 1, 1}, {1, -1, -1, 1}}, {{1, -1, 1, 1}, {1, -1, 1, -1}}, {{1, -1, 1, 1}, {-1, -1, 1,1}},{{1, 1, -1, 1}, {1, -1, -1, 1}}, {{1, 1, -1, 1}, {1, 1, 1,1}}, {{1, 1, -1, 1}, {1, 1, -1, -1}},{{1, 1, 1, 1}, {-1, 1, 1, 1}}, {{1, 1, 1, 1}, {1, 1, 1, -1}},{{-1, -1, -1, -1}, {1, -1, -1, -1}}, {{-1, -1, -1, -1}, {-1, 1, -1, -1}}, {{-1, -1, -1, -1}, {-1, -1, 1, -1}},{{-1, -1, 1, -1}, {1, -1, 1, -1}}, {{-1, -1, 1, -1}, {-1, 1, 1, -1}},{{-1, 1, -1, -1}, {1, 1, -1, -1}}, {{-1, 1, -1, -1}, {-1, 1,1, -1}},{{-1, 1, 1, -1}, {1, 1, 1, -1}}, {{-1, 1, 1, -1}, {-1, 1, 1, 1}},{{1, -1, -1, -1}, {1, 1, -1, -1}}, {{1, -1, -1, -1}, {1, -1, 1, -1}}, {{1, -1, -1, -1}, {1, -1, -1, 1}},{{1, -1, 1, -1}, {1, 1, 1, -1}},{{1, 1, -1, -1}, {1, 1, 1, -1}}, {{1, 1, -1, -1}, {1, 1, 1, -1}}},PlotRange -> All, AxesLabel -> {x, y, z}]
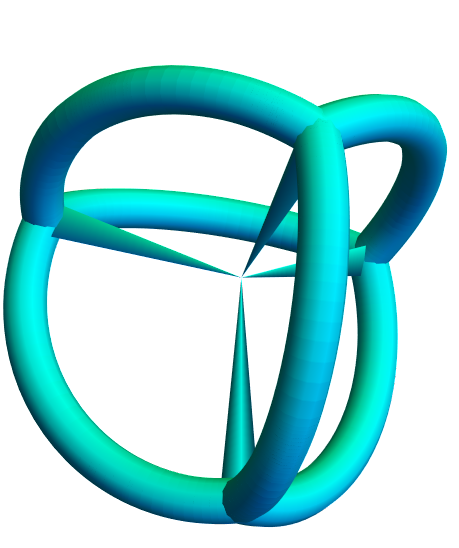
5-cell:
Coords4 = {{1/24 (5 - Sqrt[5]) + 1/24 (15 + Sqrt[5]),1/120 (-15 - Sqrt[5]) + 1/30 (5 - Sqrt[5]) + 1/24 (-5 + Sqrt[5]),1/120 (-15 - Sqrt[5]) + 1/30 (5 - Sqrt[5]) + 1/24 (-5 + Sqrt[5]),3/40 (-5 + Sqrt[5]) +1/40 (15 + Sqrt[5])}, {1/120 (-15 - Sqrt[5]) +1/30 (5 - Sqrt[5]) + 1/24 (-5 + Sqrt[5]),1/24 (5 - Sqrt[5]) + 1/24 (15 + Sqrt[5]), 1/120 (-15 - Sqrt[5]) + 1/30 (5 - Sqrt[5]) + 1/24 (-5 + Sqrt[5]),3/40 (-5 + Sqrt[5]) + 1/40 (15 + Sqrt[5])}, {1/120 (-15 - Sqrt[5]) + 1/30 (5 - Sqrt[5]) + 1/24 (-5 + Sqrt[5]),1/120 (-15 - Sqrt[5]) + 1/30 (5 - Sqrt[5]) + 1/24 (-5 + Sqrt[5]),1/24 (5 - Sqrt[5]) + 1/24 (15 + Sqrt[5]),3/40 (-5 + Sqrt[5]) + 1/40 (15 + Sqrt[5])}, {1/40 (-15 - Sqrt[5]) + 1/60 (5 - Sqrt[5]) + 1/24 (-5 + Sqrt[5]),1/40 (-15 - Sqrt[5]) + 1/60 (5 - Sqrt[5]) + 1/24 (-5 + Sqrt[5]),1/40 (-15 - Sqrt[5]) + 1/60 (5 - Sqrt[5]) + 1/24 (-5 + Sqrt[5]),3/40 (-5 + Sqrt[5]) + 1/40 (15 + Sqrt[5])}, {0, 0, 0, -(2/Sqrt[5])}}
AdjMat = {1, 2, 1, 3, 1, 4, 1, 5, 2, 3, 2, 4, 2, 5, 3, 4, 3, 5, 4, 5}
Show[greatCircleArcProjection[#] & /@ Table[{Coords4[[AdjMat[[2 i]]]], Coords4[[AdjMat[[2 i - 1]]]]}, {i,10}], PlotRange -> All, AxesLabel -> {x,y, z}]
(Hence why a more efficient method would be nice)

drawing[{{x1, x2 , x3 , x4 }, {y1 , y2 , y3 , y4 }}]did you use? $\endgroup$