3
$\begingroup$

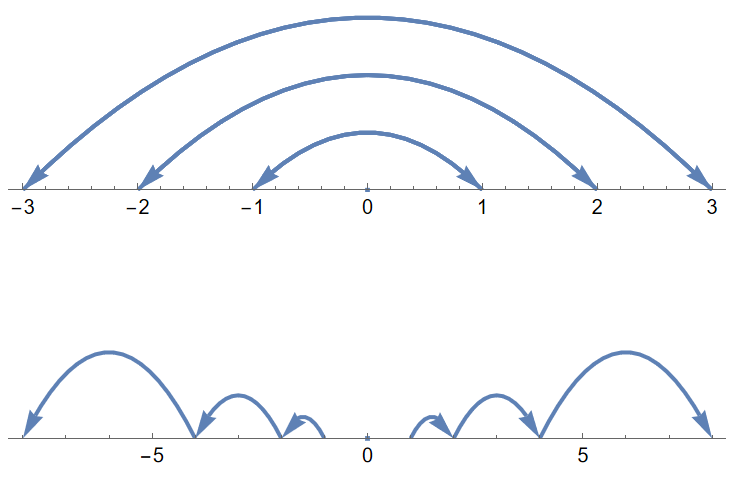
I am looking for a way to generate the phase portrait on the real line of the orbits of maps, such as

$$f(x)=-x$$

which orbit has the phase portrait :

enter image description here

Then another example:

$$g(x)=2x$$

has an orbit with the following phase portrait

enter image description here

This is explained in Devaney "Chaotic Dynamical Systems".

No such options are available for either Mathematica or MATLAB. Only the regular phase portrait for the solutions of ODEs. But this is phase portrait for maps and the periods of their orbits.

$\endgroup$

1 Answer 1

5
$\begingroup$

Here is a simple implementation using a manually specified intial points:

plotOrbits[f_, x0s_, steps_ : 3] := Module[{orbits},
  orbits = Catenate@Table[
   Rest@NestList[{Last[#], f[Last[#]]} &, {x0}, steps], {x0, x0s}];
  Graphics[{Thick, ColorData[97][1], 
    MapApply[
     Arrow[BSplineCurve[{{#1, 0}, {(#1 + #2)/2, Abs[#1]}, {#2, 0}}]] &, orbits]}, 
   Axes -> {True, False}]
  ]

f[x_] := -x
plotOrbits[f, Range[0, 3]]

f[x_] := 2 x
plotOrbits[f, {-1, 0, 1}]

enter image description here

$\endgroup$
3
  • $\begingroup$ Thanks @Domen, this is superb! $\endgroup$ Commented Mar 25 at 13:41
  • $\begingroup$ How do you set the domain of x in your command? If you consider f[x_] := x^2+1/4 plotOrbits[f, Range[-3, 3]], you see that it does not give a clear graph. $\endgroup$ Commented Apr 17 at 9:20
  • 1
    $\begingroup$ Just start with smaller x values, for example: plotOrbits[f, Range[-1, 1]] $\endgroup$
    – Domen
    Commented Apr 17 at 12:19

Your Answer

By clicking “Post Your Answer”, you agree to our terms of service and acknowledge you have read our privacy policy.

Not the answer you're looking for? Browse other questions tagged or ask your own question.