$Version

(* "13.3.1 for Mac OS X ARM (64-bit) (July 24, 2023)" *)

Clear["Global`*"]

Needs["StandardAtmosphere`"]

data = Table[{alt, MeanFreePath[alt Quantity[1, "Kilometers"]][[1]]},
     {alt, 0, 110, 0.5}];
Fit the log of the data
Exp[(nlm2 =
    NonlinearModelFit[{#[[1]], Log[#[[2]]]} & /@ data, a*x + b, {a, b}, x]) //
   Normal]

(* E^(-16.8632 + 0.147609 x) *)

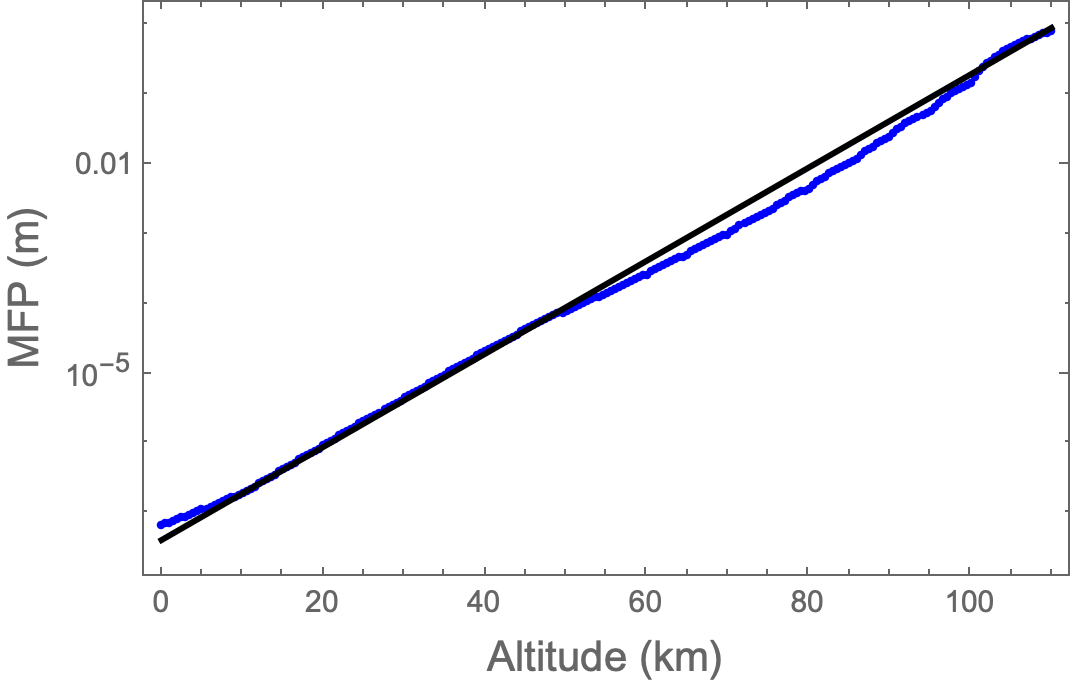
Show[
 ListLogPlot[data,
  PlotStyle -> Blue],
 LogPlot[Exp[nlm2[x]], {x, 0, 110},
  PlotStyle -> Black],
 Frame -> True,
 FrameLabel -> {Style["Altitude (km)", 14], Style["MFP (m)", 14]}]

EDIT: Alternatively, since
A*Exp[(x - B)*C] == Exp[Log[A]]*Exp[C*x - B*C] ==
  Exp[C*x - (B*C - Log[A])] // Simplify

(* True *)
The model has only two parameters. Use Exp[a*x + b]
To determine initial estimates for the NonlinearModelFit, use two widely separated data points
paramEst =
 SolveValues[Exp[a*#[[1]] + b] == #[[2]] & /@ data[[{1, -1}]], {a, b}][[1]] //
   Quiet

(* {0.148094, -16.5286} *)

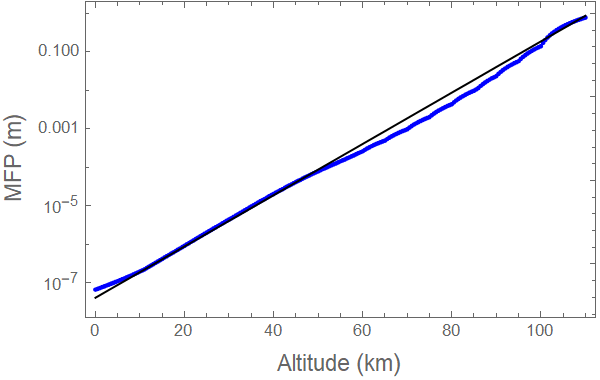
(nlm3 = NonlinearModelFit[data, Exp[a*x + b], Transpose[{{a, b}, paramEst}],
    x]) // Normal

(* E^(-17.0152 + 0.153491 x) *)

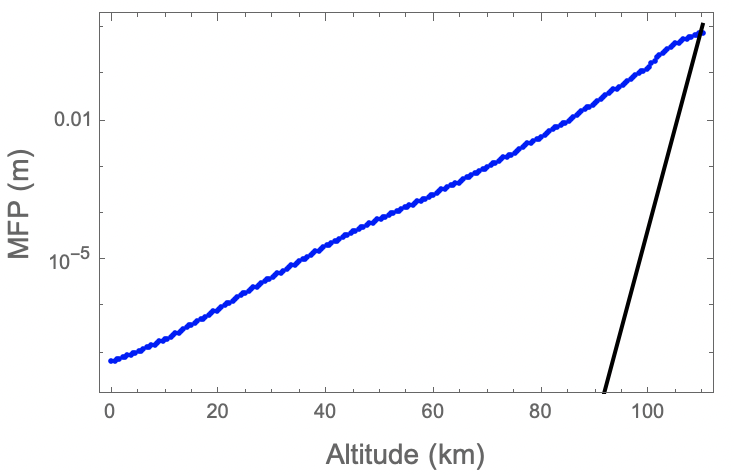
Show[ListLogPlot[data, PlotStyle -> Blue],
 LogPlot[nlm3[x], {x, 0, 110}, PlotStyle -> Black], Frame -> True,
 FrameLabel -> {Style["Altitude (km)", 14], Style["MFP (m)", 14]}]


LogPlotinstead ofPlot, to match theListLogPlotyou used for your data. We can't investigate further becauseMeanFreePathis not defined in your code, so we can't run it. $\endgroup$StandardAtmospherepackage, added. $\endgroup$