2
$\begingroup$

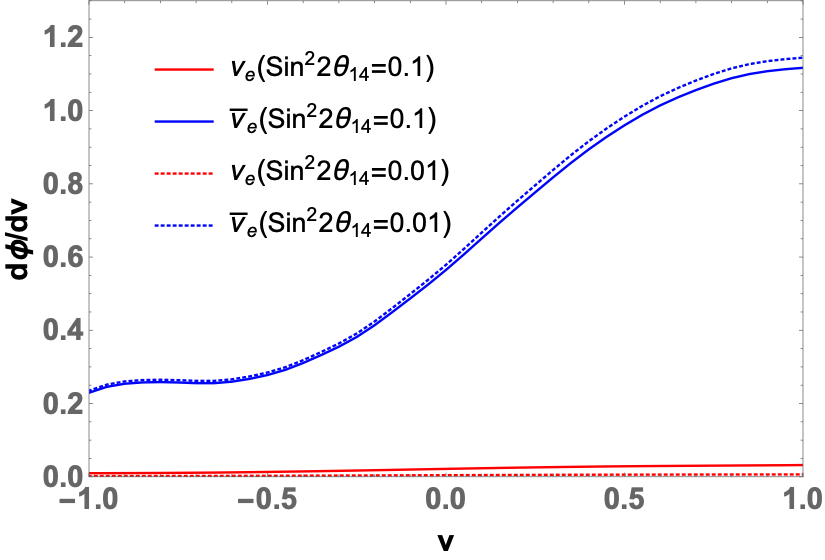
I am plotting 4 data files in one plot like this :

 Legended[ListLinePlot[{p1, p2, p3, p4}, 
  PlotRange -> {{-1.0, 1.0}, {0, 1.3}}, Frame -> True, Axes -> False, 
  FrameTicksStyle -> Directive[FontSize -> 20, Bold], 
  ImageSize -> 550, 
  PlotStyle -> {{Red, Dashing[None]}, {Blue, Dashing[None]}, {Red, 
     Dashing[Tiny]}, {Blue, Dashing[Tiny]}}, 
  FrameLabel -> {Style["v", 20, Bold, Black], 
    Style["d\[Phi]/dv", 20, Bold, Black]}, AspectRatio -> 2/3], 
 Placed[LineLegend[{Directive[{Red, Dashing[None]}], 
    Directive[{Blue, Dashing[None]}], Directive[{Red, Dashing[Tiny]}],
     Directive[{Blue, 
      Dashing[Tiny]}]}, {"\!\(\*SubscriptBox[\(\[Nu]\), \(e\)]\)(\!\(\
\*SuperscriptBox[\(Sin\), \(2\)]\)2\!\(\*SubscriptBox[\(\[Theta]\), \
\(14\)]\)=0.1)", 
    "\!\(\*SubscriptBox[OverscriptBox[\(\[Nu]\), \(_\)], \
\(e\)]\)(\!\(\*SuperscriptBox[\(Sin\), \(2\)]\)2\!\(\*SubscriptBox[\(\
\[Theta]\), \(14\)]\)=0.1)", 
    "\!\(\*SubscriptBox[\(\[Nu]\), \
\(e\)]\)(\!\(\*SuperscriptBox[\(Sin\), \(2\)]\)2\!\(\*SubscriptBox[\(\
\[Theta]\), \(14\)]\)=0.01)", 
    "\!\(\*SubscriptBox[OverscriptBox[\(\[Nu]\), \(_\)], \
\(e\)]\)(\!\(\*SuperscriptBox[\(Sin\), \(2\)]\)2\!\(\*SubscriptBox[\(\
\[Theta]\), \(14\)]\)=0.01)"}, LabelStyle -> Directive[18]], {0.3, 
   0.7}]]

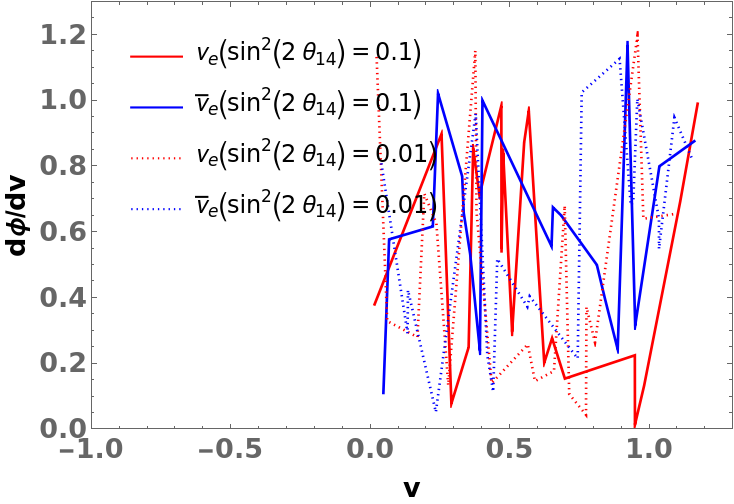
and the plot look like this :

enter image description here

Now what I want is to add a specific legend label for solid lines and another label for dashed lines on the top of the current legends. How to do that?

$\endgroup$
2
  • 1
    $\begingroup$ You do not accept answers. All submitted answers have checkmarks next to them and you can select only one of these. Upon selection, the checkmark will turn green. In addition, you can upvote answers as well. Search engines prioritize pages with accepted answers. It is also the accepted way to say "Thanks" on all SE sites. $\endgroup$
    – Syed
    Commented Nov 13, 2023 at 6:43
  • $\begingroup$ Thank you for letting me know. $\endgroup$
    – maddy
    Commented Nov 13, 2023 at 8:04

2 Answers 2

4
$\begingroup$
SeedRandom[1];
data = Map[SortBy[First]]@RandomReal[1.2, {4, 20, 2}]; 

plotstyles = Directive @@@ Tuples[{Dashing /@ {None, Tiny}, {Red, Blue}}];

options = {PlotRange -> {{-1, 1.3}, {0, 1.3}}, 
   Frame -> True, 
   Axes -> False, 
   FrameTicksStyle -> Directive[FontSize -> 20, Bold], 
   ImageSize -> 550, 
   PlotStyle -> plotstyles, 
   FrameLabel -> {Style["v", 20, Bold, Black], Style["dϕ/dv", 20, Bold, Black]}, 
   AspectRatio -> 2/3};

legendLabels = MapApply[ToString[
      Subscript[#2 @ ν, e][Superscript[sin, 2][2 Subscript[θ, 14]] == #], 
      TraditionalForm] &] @
   Tuples[{ {0.1, 0.01}, {Identity, OverBar}}];

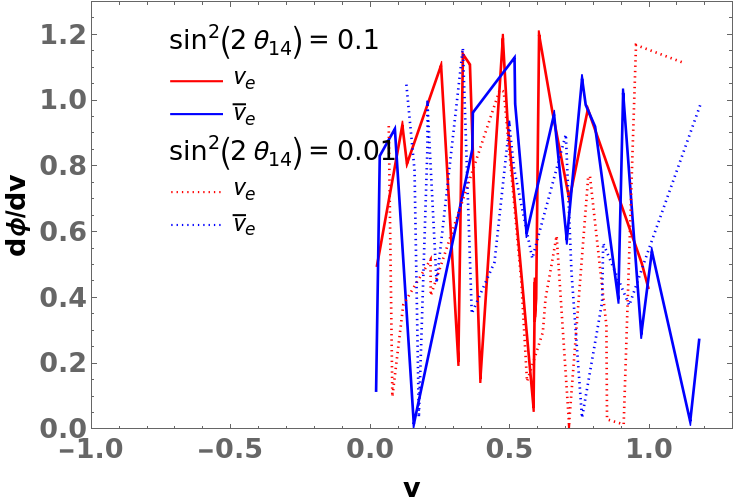
With these definitions, we can produce an output similar to the one in OP:

llp = ListLinePlot[data, Evaluate @ options];

linelegend = LineLegend[plotstyles, legendLabels, LabelStyle -> Directive[18]];

Legended[llp, Placed[linelegend, {0.3, 0.7}]]

enter image description here

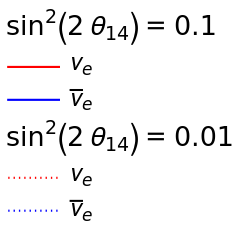
Two functions to modify legend layout and legend labels:

ClearAll[groupLegends, modifyLabels]

groupLegends[groupsizes_, grouplabels_] := Append[LegendLayout -> 
  (Grid[Join @@ MapThread[Prepend] @
    {TakeList[#, groupsizes], {#, SpanFromLeft} & /@ grouplabels},
   Alignment -> {Left, Center}] &)];

modifyLabels[newlabels_] := ReplacePart[#, {2} -> newlabels] &;

Examples:

groupSizes = {2, 2};

groupLabels = Style[#, 20] & /@ (ToString[#, TraditionalForm] & /@ 
     DeleteDuplicates[# & @@@ ToExpression @ legendLabels]);

newLegendLabels = Map[ToString[#, TraditionalForm] &] @ 
   Map[Head] @ ToExpression @ legendLabels;

modifyLabels[newLegendLabels] @ 
 groupLegends[groupSizes, groupLabels] @ 
  linelegend

enter image description here

Legended[llp, 
 Placed[
   modifyLabels[newLegendLabels] @
    groupLegends[groupSizes, groupLabels] @ linelegend,
  {0.3, 0.7}]]

enter image description here

$\endgroup$
2
$\begingroup$

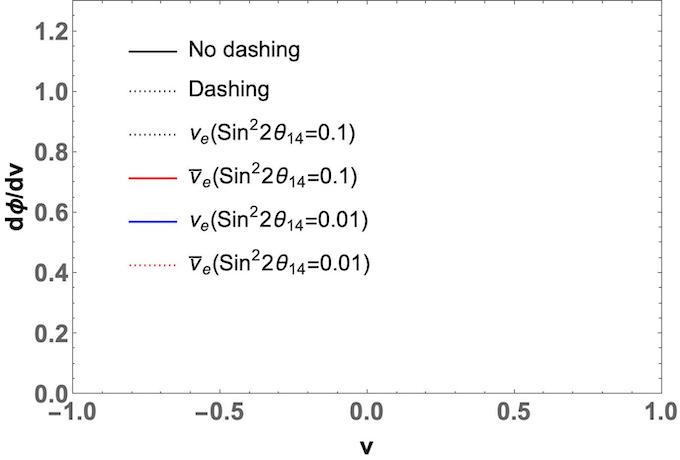
Like this?

Legended[
 ListLinePlot[{p1, p2, p3, p4}, PlotRange -> {{-1.0, 1.0}, {0, 1.3}}, 
  Frame -> True, Axes -> False, 
  FrameTicksStyle -> Directive[FontSize -> 20, Bold], 
  ImageSize -> 550, 
  PlotStyle -> {{Red, Dashing[None]}, {Blue, Dashing[None]}, {Red, 
     Dashing[Tiny]}, {Blue, Dashing[Tiny]}}, 
  FrameLabel -> {Style["v", 20, Bold, Black], 
    Style["d\[Phi]/dv", 20, Bold, Black]}, AspectRatio -> 2/3], 
 Placed[LineLegend[{Directive[{Black, Dashing[None]}], 
    Directive[{Black, Dashing[Tiny]}], 
    Directive[{Black, Dashing[Tiny]}], 
    Directive[{Red, Dashing[None]}], Directive[{Blue, Dashing[None]}],
     Directive[{Red, Dashing[Tiny]}], 
    Directive[{Blue, Dashing[Tiny]}]}, {"No dashing", "Dashing", 
    "\!\(\*SubscriptBox[\(\[Nu]\), \
\(e\)]\)(\!\(\*SuperscriptBox[\(Sin\), \(2\)]\)2\!\(\*SubscriptBox[\
\(\[Theta]\), \(14\)]\)=0.1)", 
    "\!\(\*SubscriptBox[OverscriptBox[\(\[Nu]\), \(_\)], \
\(e\)]\)(\!\(\*SuperscriptBox[\(Sin\), \(2\)]\)2\!\(\*SubscriptBox[\
\(\[Theta]\), \(14\)]\)=0.1)", 
    "\!\(\*SubscriptBox[\(\[Nu]\), \
\(e\)]\)(\!\(\*SuperscriptBox[\(Sin\), \(2\)]\)2\!\(\*SubscriptBox[\
\(\[Theta]\), \(14\)]\)=0.01)", 
    "\!\(\*SubscriptBox[OverscriptBox[\(\[Nu]\), \(_\)], \
\(e\)]\)(\!\(\*SuperscriptBox[\(Sin\), \(2\)]\)2\!\(\*SubscriptBox[\
\(\[Theta]\), \(14\)]\)=0.01)"}, LabelStyle -> Directive[18]], {0.3, 
   0.6}]]

enter image description here

$\endgroup$
2
  • $\begingroup$ Actually what I want is like a heading "sin^2 2 \theta_14 = 0.1" under which it will show two solid lines, one for \nu_e and other for \bar \nu_e. Then again a heading as "sin^2 2 \theta_14 = 0.01" under which it will show two dashed lines, one for \nu_e and other for \bar \nu_e . $\endgroup$
    – maddy
    Commented Nov 13, 2023 at 7:15
  • $\begingroup$ Basically i don't want to write "sin^2 2 \theta_14" again and again. I am finding a way to do that. $\endgroup$
    – maddy
    Commented Nov 13, 2023 at 7:16

Your Answer

By clicking “Post Your Answer”, you agree to our terms of service and acknowledge you have read our privacy policy.

Not the answer you're looking for? Browse other questions tagged or ask your own question.