0
$\begingroup$

Data

{2.5984*10^-56,1.2266*10^-25,2.77402*10^-19,1.14182*10^-15,3.43647*10^-13,2.46313*10^-11,7.13917*10^-10,1.11045*10^-8,1.09754*10^-7,7.68589*10^-7,4.10723*10^-6,0.0000176576,0.0000634956,0.000196694,0.000537035,0.00131592,0.00293618,0.00603686,0.0115497,0.0207306,0.035151,0.0566368,0.0871538,0.128646,0.18284,0.25105,0.333986,0.43162,0.543096,0.666724,0.800034,0.939904,1.08273,1.22464,1.36169,1.49013,1.60652,1.70795,1.79211,1.85739,1.90287,1.92831,1.93411,1.92122,1.89103,1.84532,1.78606,1.71543,1.6356,1.54874,1.45694,1.36212,1.26602,1.17018,1.07592,0.984329,0.896293,0.812488,0.733406,0.659374,0.590571,0.527055,0.468779,0.415615,0.36737,0.323804,0.284642,0.249587,0.218334,0.190572,0.165997,0.144312,0.125236,0.1085,0.0938559,0.0810734,0.0699408,0.0602653,0.0518725,0.0446053,0.038323,0.0329003,0.0282261,0.0242021,0.0207417,0.0177691,0.0152178,0.0130299,0.0111549,0.0095491,0.00817446,0.00699822,0.00599209,0.00513167,0.00439598,0.003767,0.00322925,0.00276948,0.00237632,0.00204006}

I'm having a little problem with the NonLinearModelFit function. I'm hoping someone can point me in the right direction please. I have this data points: https://www.dropbox.com/s/5hflg2nvko26hpz/question.nb

When I plot the data points I have this:
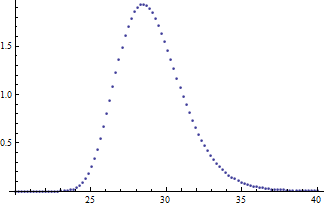
datapoints

Then I use a Rice (Rician) Distribution Curve as model for fitting. For this, I used $$\frac{x \exp \left(-\frac{v^2+x^2}{2 \sigma ^2}\right) I_0\left(\frac{x v}{\sigma ^2}\right)}{\sigma ^2}$$

But when I plot both curves together I get something like this figure where the fit is the very tiny one below: enter image description here
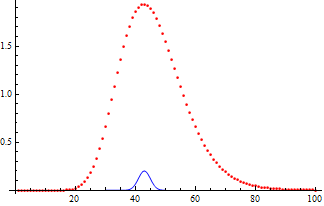
I checked the Residual fit and I got something really disturbing. Showing that my fit has a large error margin:
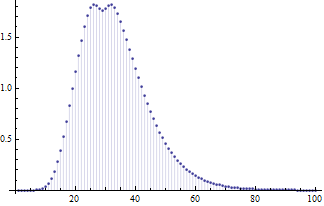
enter image description here

Honestly, I'm not sure what's wrong. I've spent some time on this and I think I need an outside eye to help look at it. Any idea will be much appreciated. Thanks friends.

$\endgroup$
6
  • 4
    $\begingroup$ I think you will need an extra parameter (an amplitude) in order to match your data (which does not have an area of 1). $\endgroup$
    – chuy
    Commented Jul 18, 2013 at 16:38
  • $\begingroup$ When I added the 3rd parameter $m$ as @PatoCriollo suggested, it doesn't seem to work well with the data. I've provided the data above maybe you may want to play around with it. The plot of the data point itself [Fig 1.] is smooth so I'm not sure what's going on. Thanks $\endgroup$
    – Afloz
    Commented Jul 19, 2013 at 3:23
  • $\begingroup$ I think you're making some confusion. The plot of the data themselves does not have to match the plot of their distribution function. $\endgroup$ Commented Jul 19, 2013 at 6:22
  • $\begingroup$ What do the 20…40 range and the values in the data represent? Is there any particular reason why you decided to use a Rice density? I'm getting reasonably good fits with a shifted gamma density, but if that's not allowed then there's little point in pursuing it. $\endgroup$ Commented Jul 21, 2013 at 1:56
  • $\begingroup$ @RayKoopman, apology for late response. I considered Rice a good fit for the original curve however, if it's not too late, I'd love to see your idea on the shifted gamma function. $\endgroup$
    – Afloz
    Commented Jul 26, 2013 at 8:28

2 Answers 2

1
$\begingroup$

@Chuy makes a valid point in the comments section of the OP. Here's the fit with a "fudge" factor, using the equation for f in the notebook you reference and assigning your data to the variable data.

xfit = NonlinearModelFit[data, fudge x/s^2 Exp[-((x^2 + v^2)/(2 s^2))] BesselI[0, (x v)/
    s^2] , {{fudge, 1}, {s, 0.5}, {v, 30}}, x]
Plot[xfit[x], {x, 0, 100}, Epilog -> {Red, PointSize[0.011], 
   Point@Transpose[{Range[Length[data]], data}]}]
xfit["BestFitParameters"]
(* {fudge -> 49.3597, s -> 10.3848, v -> 43.0833} *)

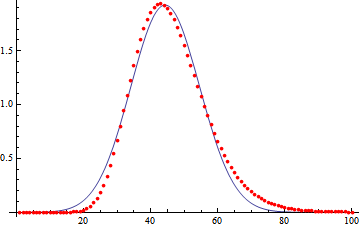
The result: a better but still not great fit.

enter image description here

$\endgroup$
4
  • $\begingroup$ Yes, this is the best I came up with as well using Rician distr. but I had to normalize the data with data/Total[data] before I got this. Would you please explain the fudge parameter means? It appears this is what @Chuy was talking about. $\endgroup$
    – Afloz
    Commented Jul 26, 2013 at 8:31
  • $\begingroup$ Oh by "fudge" you mean something like an "enabler" or a"heuristic" a "weighting factor"? is that what you mean? $\endgroup$
    – Afloz
    Commented Jul 26, 2013 at 8:49
  • $\begingroup$ @Methyl yes. I chose the more 'technical' term :-). There are cases when you may not want to normalize the data and this is one option in such cases. $\endgroup$ Commented Jul 26, 2013 at 12:21
  • $\begingroup$ Ahaha. That makes sense. I'll call it the "Fudge Fit Factor". Thanks a lot B. You've done more that fit my data ;) $\endgroup$
    – Afloz
    Commented Jul 26, 2013 at 15:55
0
$\begingroup$

sorry I can't access your notebook file. We got a firewall restriction at work to access online storage site.

I hope you find the following code helpful.

sample = RandomVariate[RiceDistribution[2.5, 3], 1000];
(*simulates your data*)
mymodel = EstimatedDistribution[sample, RiceDistribution[m, \[Alpha], \[Beta]]]
Show[Histogram[sample, 20, "ProbabilityDensity"], Plot[PDF[mymodel, x], {x, 0, 14}]]
$\endgroup$
2
  • $\begingroup$ Your last line is not going to work; you can use this, straight from the docs : Histogram[data, Automatic, "PDF", Epilog -> First@Plot[PDF[mymodel, x], {x, 0, 2}, PlotStyle -> Red]]. $\endgroup$ Commented Jul 19, 2013 at 6:23
  • $\begingroup$ Thanks for the tip @b.gatessucks $\endgroup$
    – Zviovich
    Commented Jul 19, 2013 at 13:13

Your Answer

By clicking “Post Your Answer”, you agree to our terms of service and acknowledge you have read our privacy policy.

Not the answer you're looking for? Browse other questions tagged or ask your own question.