2
$\begingroup$

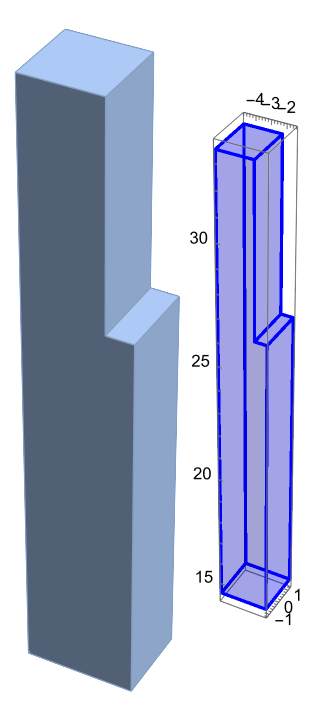
Consider the following region:

Vol1 = Parallelepiped[{-4.75, -1.25, 
    14.5}, {{3.35, 0, 0}, {0, 2.5, 0}, {0, 0, 12}}];
Vol2 = Parallelepiped[{-4.75, -1.25, 
    14.5 + 12}, {{2.5, 0, 0}, {0, 2.5, 0}, {0, 0, 7}}];
Vol = RegionUnion[Vol1, Vol2];

It looks like

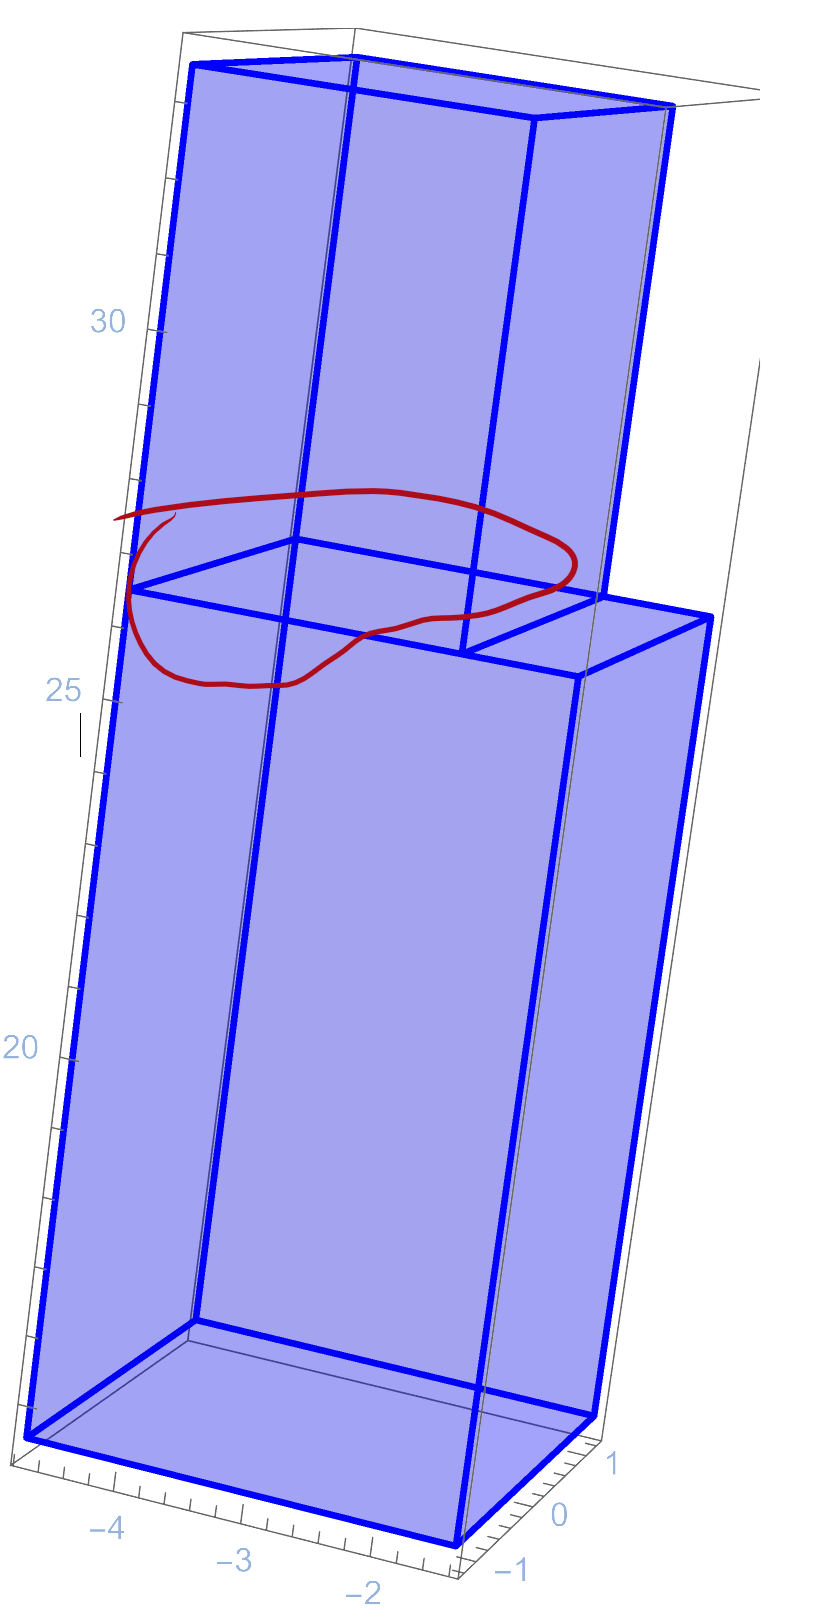
PlotVol = 
 Region[Style[Vol, Blue, Opacity[0.2], EdgeForm[{Thick, Blue}]], 
  BoxRatios -> {1, 1, 10}, Boxed -> True, Axes -> True]

enter image description here

Could you please tell me how to get rid of the contour of their boundaries in the plot (shown in red)?

$\endgroup$

1 Answer 1

8
$\begingroup$
reg=Vol // BoundaryDiscretizeRegion // Region`Mesh`MergeCells
Region[Style[reg, Blue, Opacity[0.2], EdgeForm[{Thick, Blue}]], 
 BoxRatios -> {1, 1, 10}, Boxed -> True, Axes -> True]

enter image description here

$\endgroup$
1
  • $\begingroup$ Vol // RegionBoundary // DiscretizeRegion // Region`Mesh`MergeCells $\endgroup$
    – cvgmt
    Commented Jul 6, 2023 at 1:14

Your Answer

By clicking “Post Your Answer”, you agree to our terms of service and acknowledge you have read our privacy policy.

Not the answer you're looking for? Browse other questions tagged or ask your own question.