3
$\begingroup$

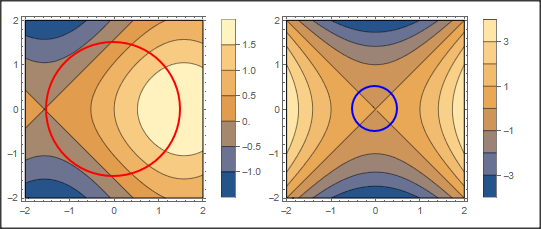
I would like to generate several plots like in my example, but use a different Epilog for each plot.

ContourPlot[{Sin[x] + Cos[y], (x)^2 - (y)^2}, {x, -2, 2}, {y, -2, 2}, 
 PlotLegends -> Automatic, PlotLayout -> "Row"
 , Epilog -> {
   {Thickness[Large], Red, Circle[{0, 0}, 1.5]},
   {Thickness[Large], Blue, Circle[{0, 0}, 0.5]}
   }
 ]

enter image description here

I'd like to have one circle on the left plot, the other circle on the right plot.

$\endgroup$

3 Answers 3

8
$\begingroup$
deleteUnwantedEpilogs = 
  Module[{pos = Position[#, HoldPattern[Epilog -> _], All]},
    Delete[#, Apply[Join] @
      MapIndexed[((x |-> Join[#, {2}, {x}]) /@ 
           Drop[Range@Length@pos, #2]) &] @ pos]] &;

Examples:

cp = ContourPlot[{Sin[x] + Cos[y], (x)^2 - (y)^2}, {x, -2, 2}, {y, -2, 2}, 
 PlotLegends -> Automatic, PlotLayout -> "Row"
 , Epilog -> {
   {Thickness[Large], Red, Circle[{0, 0}, 1.5]},
   {Thickness[Large], Blue, Circle[{0, 0}, 0.5]}
   }
 ];

deleteUnwantedEpilogs @ cp

enter image description here

deleteUnwantedEpilogs @
 ContourPlot[{Sin[x] + Cos[y], (x)^2 - (y)^2, Sin[x y]}, {x, -2, 2}, {y, -2, 2},
  PlotLegends -> Automatic, PlotLayout -> "Row", 
  Epilog -> {{Thickness[Large], Red, Circle[{0, 0}, 1.5]}, 
    {Thickness[Large], Blue, Circle[{0, 0}, 0.5]}, 
    {Thickness[Large], Green, Circle[{0, 0}, 0.25]}}]

enter image description here

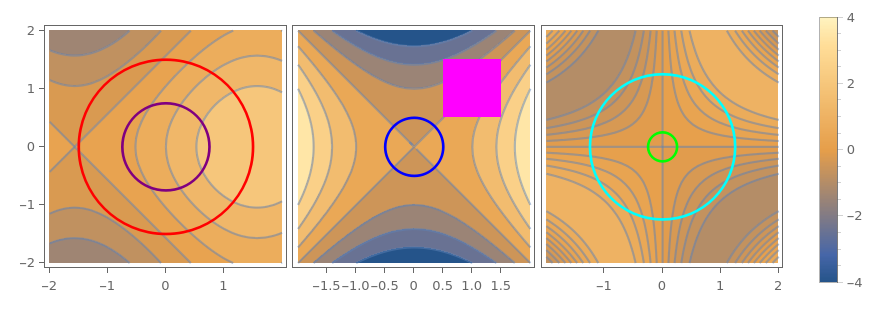
Replace Epilog -> ... with

Epilog -> 
 {{Thickness[Large], Red, Circle[{0, 0}, 1.5], Purple,  Circle[{0, 0}, .75]}, 
  {Thickness[Large], Blue, Circle[{0, 0}, 0.5], Magenta, Rectangle[{.5, .5}]}, 
  {Thickness[Large], Green, Circle[{0, 0}, 0.25], Cyan, Circle[{0, 0}, 1.25]}}

to get
enter image description here

$\endgroup$
1
  • $\begingroup$ Cool, generate all Epilogs and delete the unwanted ones later. I'll happily accept that! $\endgroup$
    – AxelF
    Commented Jun 29, 2023 at 9:52
3
$\begingroup$
Clear["Global`*"]

Legended[
 GraphicsGrid[
  {ContourPlot[#[[1]],
      {x, -2, 2}, {y, -2, 2},
      Epilog -> {Thickness[Large], #[[2]], Circle[{0, 0}, #[[3]]]},
      ImagePadding -> #[[4]]] & /@ {
     {Sin[x] + Cos[y], Red, 1.5, Automatic},
     {x^2 - y^2, Blue, 0.5, {{0., 28.7192}, {-1., 25.8194}}}}},
  Spacings -> 0],
 BarLegend[{"WL13DefaultDensityGradient", {-4, 4}}]]

enter image description here

$\endgroup$
2
$\begingroup$

Something like:

epi1 = {Thickness[Large], Red, Circle[{0, 0}, 1.5]};
epi2 = {Thickness[Large], Blue, Circle[{0, 0}, 0.5]};

Row[{ContourPlot[{Sin[x] + Cos[y]}, {x, -2, 2}, {y, -2, 2}, 
   PlotLegends -> Automatic, ImageSize -> 200, BoundaryStyle -> Black,
    Epilog -> epi1],
  ContourPlot[{(x)^2 - (y)^2}, {x, -2, 2}, {y, -2, 2}, 
   PlotLegends -> Automatic, ImageSize -> 200, BoundaryStyle -> Black,
    Epilog -> epi2]
  }]

enter image description here

$\endgroup$
1
  • $\begingroup$ This creates to separate axes and two separate legends, which I tried to avoid. With PlotLayout, I'll get the same legend for both plots and a common color scale $\endgroup$
    – AxelF
    Commented Jun 29, 2023 at 9:50

Your Answer

By clicking “Post Your Answer”, you agree to our terms of service and acknowledge you have read our privacy policy.

Not the answer you're looking for? Browse other questions tagged or ask your own question.