5
$\begingroup$
Plot[x^2, {x, -2, 2}, Filling -> {1 -> Top}, 
 FillingStyle -> Automatic, 
 ColorFunction -> {Function[{x, y}, ColorData["Rainbow"][4 y]]}]

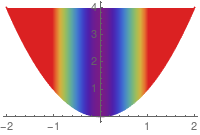
The above code produces a graph

enter image description here

However, I want it to be filled vertically. The colour gradient should be along Y-Axis, which is currently along X-Axis. Changing y to x (...ColorData["Rainbow"][4 y]]) doesn't solve the problem.

Please help me out.

$\endgroup$

3 Answers 3

9
$\begingroup$

a solution using RegionPlot:

RegionPlot[y > x^2, {x, -2, 2}, {y, 0, 4}, 
     ColorFunction -> Function[{x, y}, ColorData["Rainbow"][y]], 
     ColorFunctionScaling -> True, BoundaryStyle -> None]
$\endgroup$
1
  • $\begingroup$ How to make the boundary smoother? $\endgroup$
    – user444
    Commented May 2, 2023 at 9:07
8
$\begingroup$

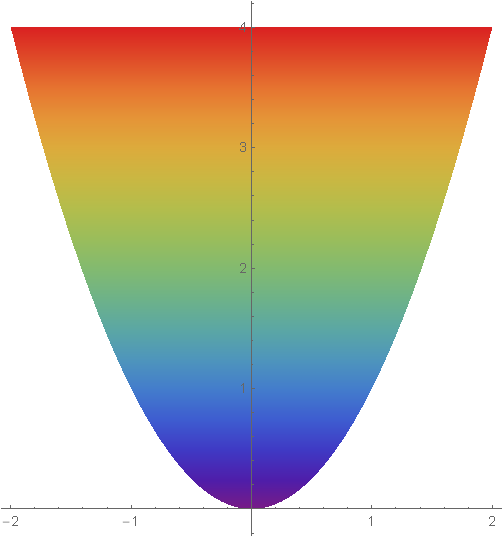
Using LinearGradientFilling:

Plot[x^2, {x, -2, 2}
 , PlotStyle -> None
 , AspectRatio -> Automatic
 , Filling -> Top
 , FillingStyle -> LinearGradientFilling["Rainbow", Top]
 ]

enter image description here

$\endgroup$
2
  • 1
    $\begingroup$ LinearGradientFilling is not available in 12.0 $\endgroup$
    – user444
    Commented May 2, 2023 at 10:11
  • 1
    $\begingroup$ The other answer provides a good solution for older versions using RegionPlot. $\endgroup$
    – Syed
    Commented May 2, 2023 at 10:16
7
$\begingroup$
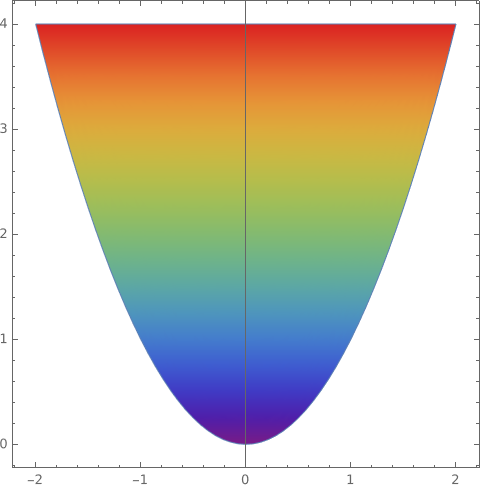
ParametricPlot[{x, 4 y + (1 - y) x^2}, {x, -2, 2}, {y, 0, 1}, 
 ColorFunction -> {Function[{x, y}, ColorData["Rainbow"][y]]}]

enter image description here

$\endgroup$

Your Answer

By clicking “Post Your Answer”, you agree to our terms of service and acknowledge you have read our privacy policy.

Not the answer you're looking for? Browse other questions tagged or ask your own question.