I have a density function $\rho(r,z)$ and I want to calculate the minimum distance $d_{min} = \sqrt{r^2 + z^2}$ from the center (0,0) in which $\rho$ becomes negative. The easiest way is to find where $\rho = 0$, since for all greater distances is always $\rho < 0$. In my system, there is a variable parameter $\delta$ which takes values in the interval [0, 1]. So, I want to monitor the evolution of $d_{min}$ as a function of $\delta$. The corresponding Mathematica code is the following:
Clear["Global`*"];
Off[FindMinimum::eit];

Vg = v0^2/2*Log[r^2 + (1 + δ)*(a + Sqrt[h^2 + b*z^2])^2 + cb^2];
Vn = (-G*Mn)/Sqrt[r^2 + z^2 + cn^2];
Vh = (-G*Mh)/Sqrt[r^2 + z^2 + ch^2];
Vt = Vg + Vn + Vh;
Vr = D[Vt, r];
Vz = D[Vt, z];
Vrr = D[Vr, r];
Vzz = D[Vz, z];
ρ = 2.325/(4*π*100)*(Vrr + Vr/r + Vzz);

G = 1;
v0 = 25; a = 3; h = 0.12; b = 1.5; cb = 2.5;
Mn = 400; cn = 0.25;
Mh = 10000; ch = 25;

data = {};
Do[
  sol = FindMinimum[{r^2 + z^2, ρ == 0}, {r, z}];
  dmin = sol[[1]];
  AppendTo[data, {δ, Sqrt[dmin]}],
  {δ, 0, 1, 0.05}
  ]

S1 = ListPlot[data, Joined -> True, Frame -> True,
FrameLabel -> {"δ", Subscript["d", "min"]},
FrameStyle -> Directive[FontSize -> 17, FontFamily -> "Times"],
PlotStyle -> Black, ImageSize -> 600, PlotRange -> {0, 200}]
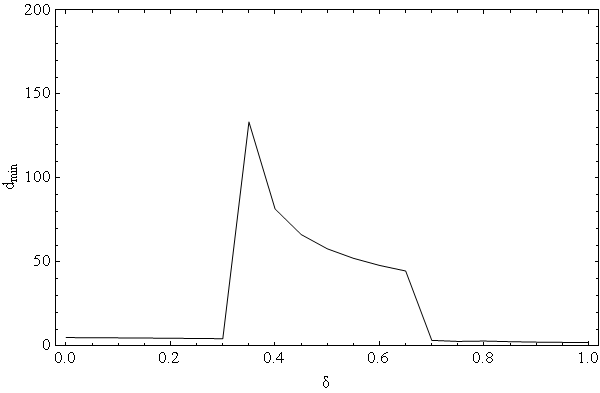
Here is the plot (S1) I get using the values obtained from the FindMinimum inside the Do loop

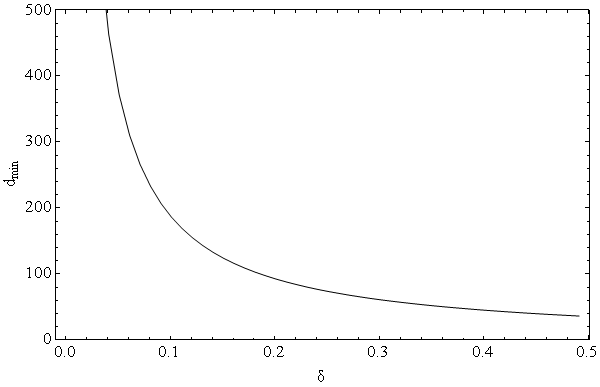
We see, that there are two horizontal areas regarding the evolution of $d_{min}$, the first one when $0 \leq \delta \leq 0.3$ and the second when $0.7 \leq \delta \leq 1$. I am quite sure that for some unknown to me reason these areas are in fact wrong. In particular, when $\delta = 0$ density is always positive so, $d_{min}$ should be infinite not almost zero as indicated in the plot. In fact, the plot should be like this

I suspect, that there might be some issue with the precision of the calculations. Any ideas?

