I have:
Clear["Global`*"]

p[n_, a_, b_] = E^(-a/n - b n)/Sum[E^(-a/n - b n), {n, 3, 12}];

exp[a_, b_] = Sum[n*p[n, a, b], {n, 3, 12}] // Simplify;

f[p6_?NumericQ] := NMinimize[{a^2 + b^2, exp[a, b] == 6, p[6, a, b] == p6}, {a, b}][[-1]]

funcs = Table[p[n, a, b] /.f[p6], {p6, {0.27, 0.25, 0.23, 0.21, 0.19, 0.17, 0.16}}];

DiscretePlot[Evaluate[funcs], {n, 3, 12}, Filling -> None,Joined -> True,
PlotLegends -> Placed[LineLegend[{0.27, 0.25, 0.23, 0.21, 0.19, 0.17, 0.16},
LegendLabel -> Style[HoldForm[Subscript[p, 6]], FontSize -> 20, FontFamily -> "Latin Modern Roman 10"],
LegendLayout -> {"Column", 2}], {0.7, 0.65}],
Ticks -> {{3, 4, 5, 6, 7, 8, 9, 10, 11, 12}, Automatic},
AxesLabel -> {Style[HoldForm[n], FontSize -> 20,
FontFamily -> "Latin Modern Roman 10"], Style[HoldForm[Subscript[p, n]], FontSize -> 20,
FontFamily -> "Latin Modern Roman 10"]},
BaseStyle -> {FontFamily -> "Latin Modern Math"}, LabelStyle -> {18, GrayLevel[0]}]
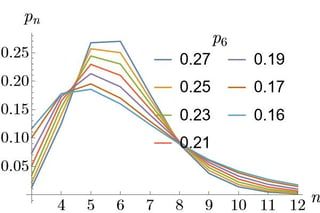
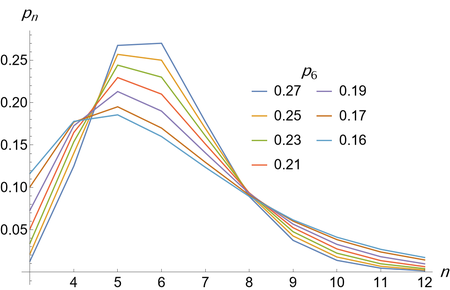
which gives:
There are two problems:
How can I change the font of numbers in legends same as numbers in the axes, i.e., both to be romans?
Legends are interfering with the plots; however, if I move them further, they will go out. Is there a way to make the plot bigger so one can move the legends further?
EDIT
The second problem is solved in @cvgmt answer.


