0
$\begingroup$

I am using ParametericNDSolveValue to numerically solve an ODE system, which I then use to find the definite integral of one of the variables in the solution for different values of a parameter. Here is a simpler (and faster!) version of my code:

eqns={y''[t] + d y[t] == 3 a Sin[y[t]], y[0] == y'[0] == 1};
pfun[din_]:=ParametricNDSolveValue[eqns/.{d-> din}, With[{b=1},b NIntegrate[y[t],{t,0,5}]],{t,0,5},{a}];

which if plotted for three values of "d" looks like this
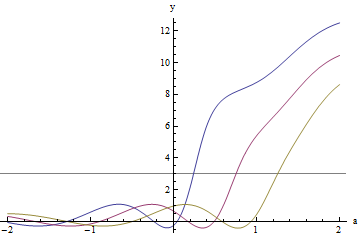
enter image description here

I am using FindRoot to find the "a" values at which these curves meet the line y=3.

Table[a /. FindRoot[pfun[din][a] == 3.0, {a, 0, 2}], {din, 1, 3, 1}]

What I would like to do next is find the value of the first derivative at each of these points (with the ultimate aim of plotting the derivatives w.r.t. the d parameter values used to make each curve). What I'm stuck on is: do I (1) first generate a list of "a" values using the code above and then somehow plug each element into code like this

Evaluate[Table[Derivative[1][pfun[din]][a], {din, 1, 3, 1}]]

(I'm not clear how to get the derivative function to call a subsequent element in the list for each din value).

or do I (2) embed the FindRoot function somehow into the derivative function? (I don't know how to do this, or do I use Table or Map?)

$\endgroup$

1 Answer 1

1
$\begingroup$

I could not completely understand your question but I would do the following by changing little bit from your definitions.

eqns = {y''[t] + d y[t] == 3 a Sin[y[t]], y[0] == y'[0] == 1};
pfun[din_] :=ParametricNDSolveValue[eqns /. {d -> din}, 
    With[{b = 1}, b Integrate[y[s], {s, 0, 5}]],{t, 0, 5}, {a}];

Then we will simply use a Module to write function that depending on the value of din will find the derivative at the point where function takes the value of $3$.

fun[din_?NumericQ] := Module[{arg, a},
 arg = a /. FindRoot[pfun[din][a] == 3.0, {a, 0, 2}];
 Evaluate[Derivative[1][pfun[din]][arg]]
 ];
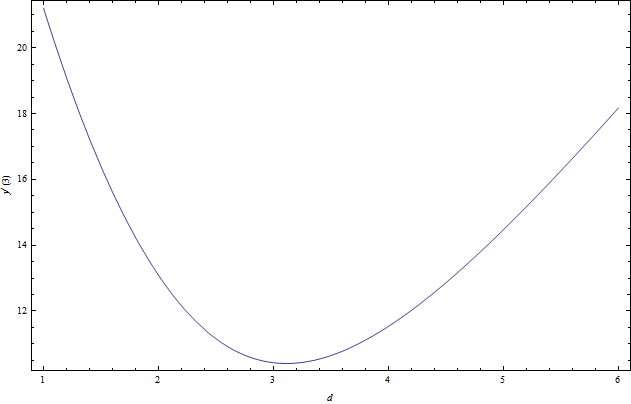
Plot[Evaluate@fun[din], {din, 1, 6}, Frame -> True,FrameLabel -> {d, y'[3]}]

enter image description here

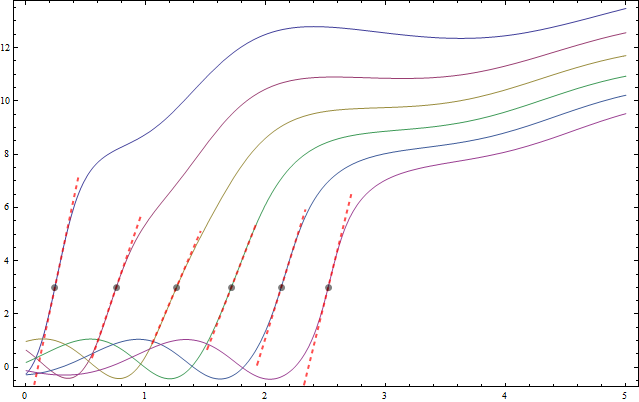
However parabolic type of the derivatives is realistic if you crosscheck the slope of the tangents in the following plot.

enter image description here

Code for the tangent plot:

Clear[tangent];
tangent[din_, eps_] := Module[{arg, der, c, a, cval},
 arg = a /. FindRoot[pfun[din][a] == 3.0, {a, 0, 2}]; 
 der = Evaluate[Derivative[1][pfun[din]][arg]];
 cval = c /. Flatten@NSolve[der *arg + c == pfun[din][arg], c];
 Plot[Evaluate@(der*x + cval), {x, arg - eps, arg + eps},PlotRange -> All, 
  PlotStyle -> Directive[Opacity[.7], Red, Thick, Dashed],
  Epilog -> {Directive[Opacity[.5], Black], PointSize[Large],Point[{arg, 3.}]}
  ]
 ];
tans = Table[tangent[din, .2], {din, 1, 6, 1}];
opt = Epilog -> ( Options[#, Epilog][[1, 2]] & /@ tans);
Show[{Plot[Evaluate@(Table[pfun[i][t], {i, 1, 6, 1}]), {t, 0, 5}, 
Frame -> True]}~Join~tans, opt]

In case this solution does not work for you feel free to leave a comment.

$\endgroup$
3
  • $\begingroup$ Thank you!! that worked perfectly :-) $\endgroup$
    – LiaChica
    Commented Jul 5, 2013 at 23:10
  • $\begingroup$ Hi there, when trying this code with my larger system of ODEs I find that Derivative is always giving values below one even though the curves (and tangents) are similar to the ones you have plotted above (i.e. slopes should be greater than one). Any ideas what could be wrong? $\endgroup$
    – LiaChica
    Commented Jul 16, 2013 at 3:13
  • $\begingroup$ I can not comment on this issue until I see the larger system. However my approach should work seamlessly as far as mathematics is concerned. $\endgroup$ Commented Jul 16, 2013 at 11:37

Your Answer

By clicking “Post Your Answer”, you agree to our terms of service and acknowledge you have read our privacy policy.

Not the answer you're looking for? Browse other questions tagged or ask your own question.