7
$\begingroup$

Given the following directed graphs:

ClearAll[one, two];
one = {1 -> 2, 1 -> 3, 3 -> 4, 4 -> 1};
two = {1 -> 2, 1 -> 3, 1 -> 4};

I generate a single directed graph by:

Graph[Join[one, two], VertexLabels -> "Name"]

It is fine. When I assign different colors for each graph like Blue for one and Red for two and ask for a layered graph plot, it does not work! I tried EdgeAdd, GraphUnion but no success. Any idea about the feasibility of such a custom-designed graph? I also consulted with IGraphM, hoping that it might have developed the code I am after, but again no success.

$\endgroup$

2 Answers 2

8
$\begingroup$

Add colors as tags to the edges:

taggededges = MapIndexed[DirectedEdge @@ 
   Append[List @@ #, 
    If[#2[[1]] <= Length@one, Red, Blue]] &] @ 
  Join[one, two]

enter image description here

Graph[taggededges, VertexLabels -> "Name", 
 EdgeStyle -> {DirectedEdge[a_, b_, c_] :> c}]

enter image description here

$\endgroup$
1
  • 1
    $\begingroup$ Thanks as usual for your excellent code. My depository of MMA codes are full of yours! $\endgroup$ Commented Jan 28, 2023 at 18:20
6
$\begingroup$
ClearAll[one, two];
one = {1 -> 2, 1 -> 3, 3 -> 4, 4 -> 1};
two = {1 -> 2, 1 -> 3, 1 -> 4};

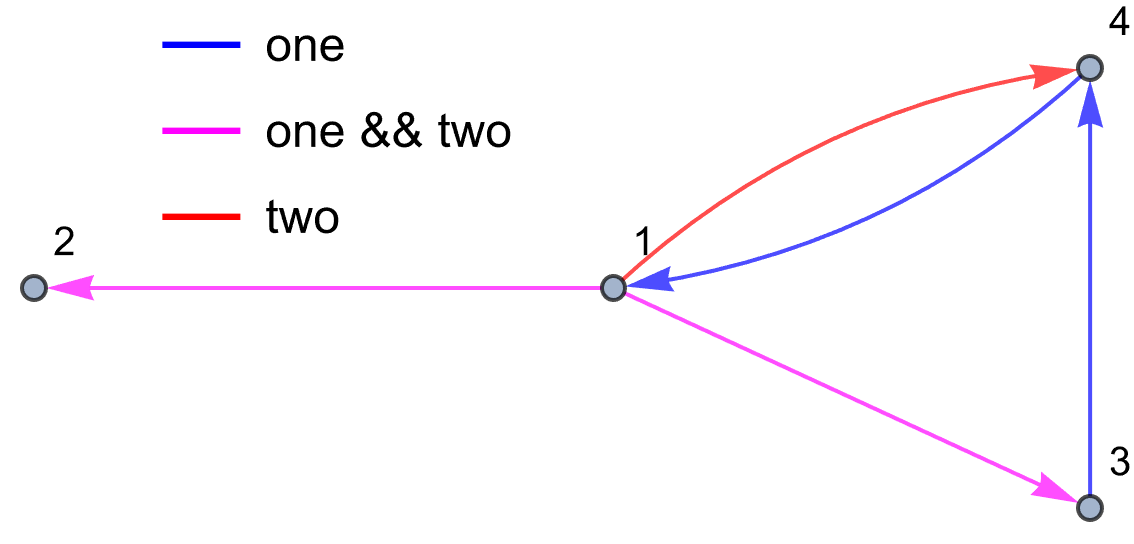
Legended[
 Graph[Join[
   Style[#, Magenta] & /@ Intersection[one, two],
   Style[#, Blue] & /@ Complement[one, two],
   Style[#, Red] & /@ Complement[two, one]], 
  VertexLabels -> "Name"],
 Placed[
  LineLegend[{Blue, Magenta, Red}, {"one", "one && two", "two"}],
  {.3, .8}]]

enter image description here

EDIT: Inspired by @kglr's excellent answer. A form which is easier for me to understand:

Legended[
 Graph[
  Join[
   one /. (x_ -> y_) ->
     Style[DirectedEdge[x, y, ""], Blue],
   two /. (x_ -> y_) ->
     Style[DirectedEdge[x, y], Red]]],
 Placed[
  LineLegend[{Blue, Red}, {"one", "two"}],
  {.3, .8}]]

enter image description here

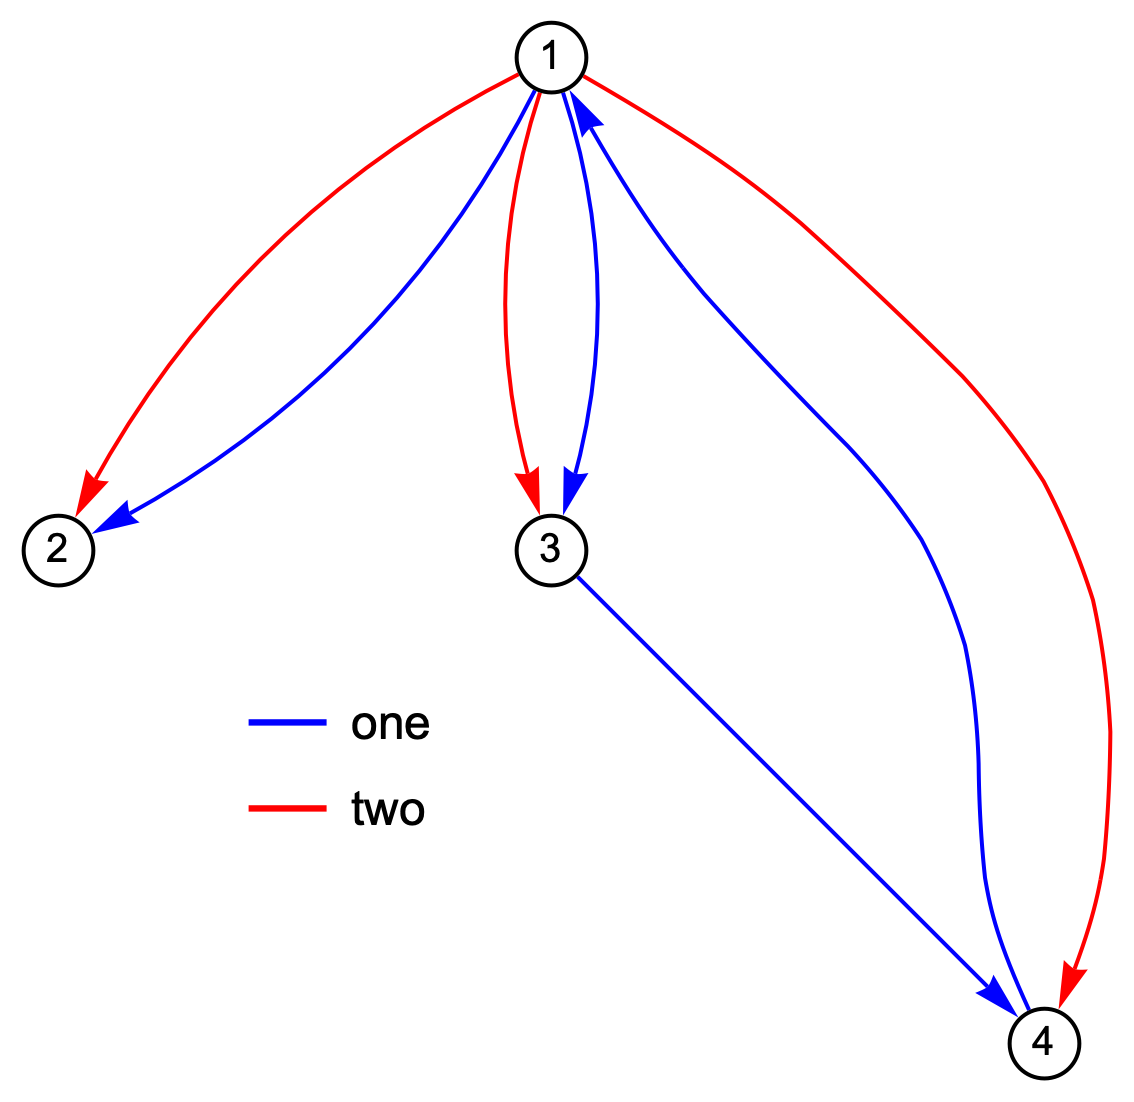
EDIT 2: For a LayeredGraphPlot

Legended[
 LayeredGraphPlot[
  Join[
   one /. (x_ -> y_) -> Style[
      DirectedEdge[x, y, ""], Blue],
   two /. (x_ -> y_) -> Style[
      DirectedEdge[x, y], Red]],
  PlotTheme -> "NameLabeled"],
 Placed[LineLegend[{Blue, Red},
   {"one", "two"}], {.3, .3}]]

enter image description here

$\endgroup$
3
  • $\begingroup$ Thanks a lot for your effort and answers. I can follow your answer with my limited knowledge of programming. kglr's excellent answer is certainly way beyond my programming boundary. $\endgroup$ Commented Jan 28, 2023 at 18:19
  • $\begingroup$ This is not a request but a note. Using kglr's code, I can generate a layered graph easily by : LayeredGraphPlot[taggededges, VertexLabels -> "Name", EdgeStyle -> {DirectedEdge[a_, b_, c_] :> c}, ImageSize -> 350]. I tried some versions of your code to do the same but could not do it. $\endgroup$ Commented Jan 28, 2023 at 18:32
  • $\begingroup$ Very nice! I tried it before writing you but somehow it did not work. It seems that I made a mistake somewhere. Thank you very much for the code. $\endgroup$ Commented Jan 28, 2023 at 20:21

Your Answer

By clicking “Post Your Answer”, you agree to our terms of service and acknowledge you have read our privacy policy.

Not the answer you're looking for? Browse other questions tagged or ask your own question.