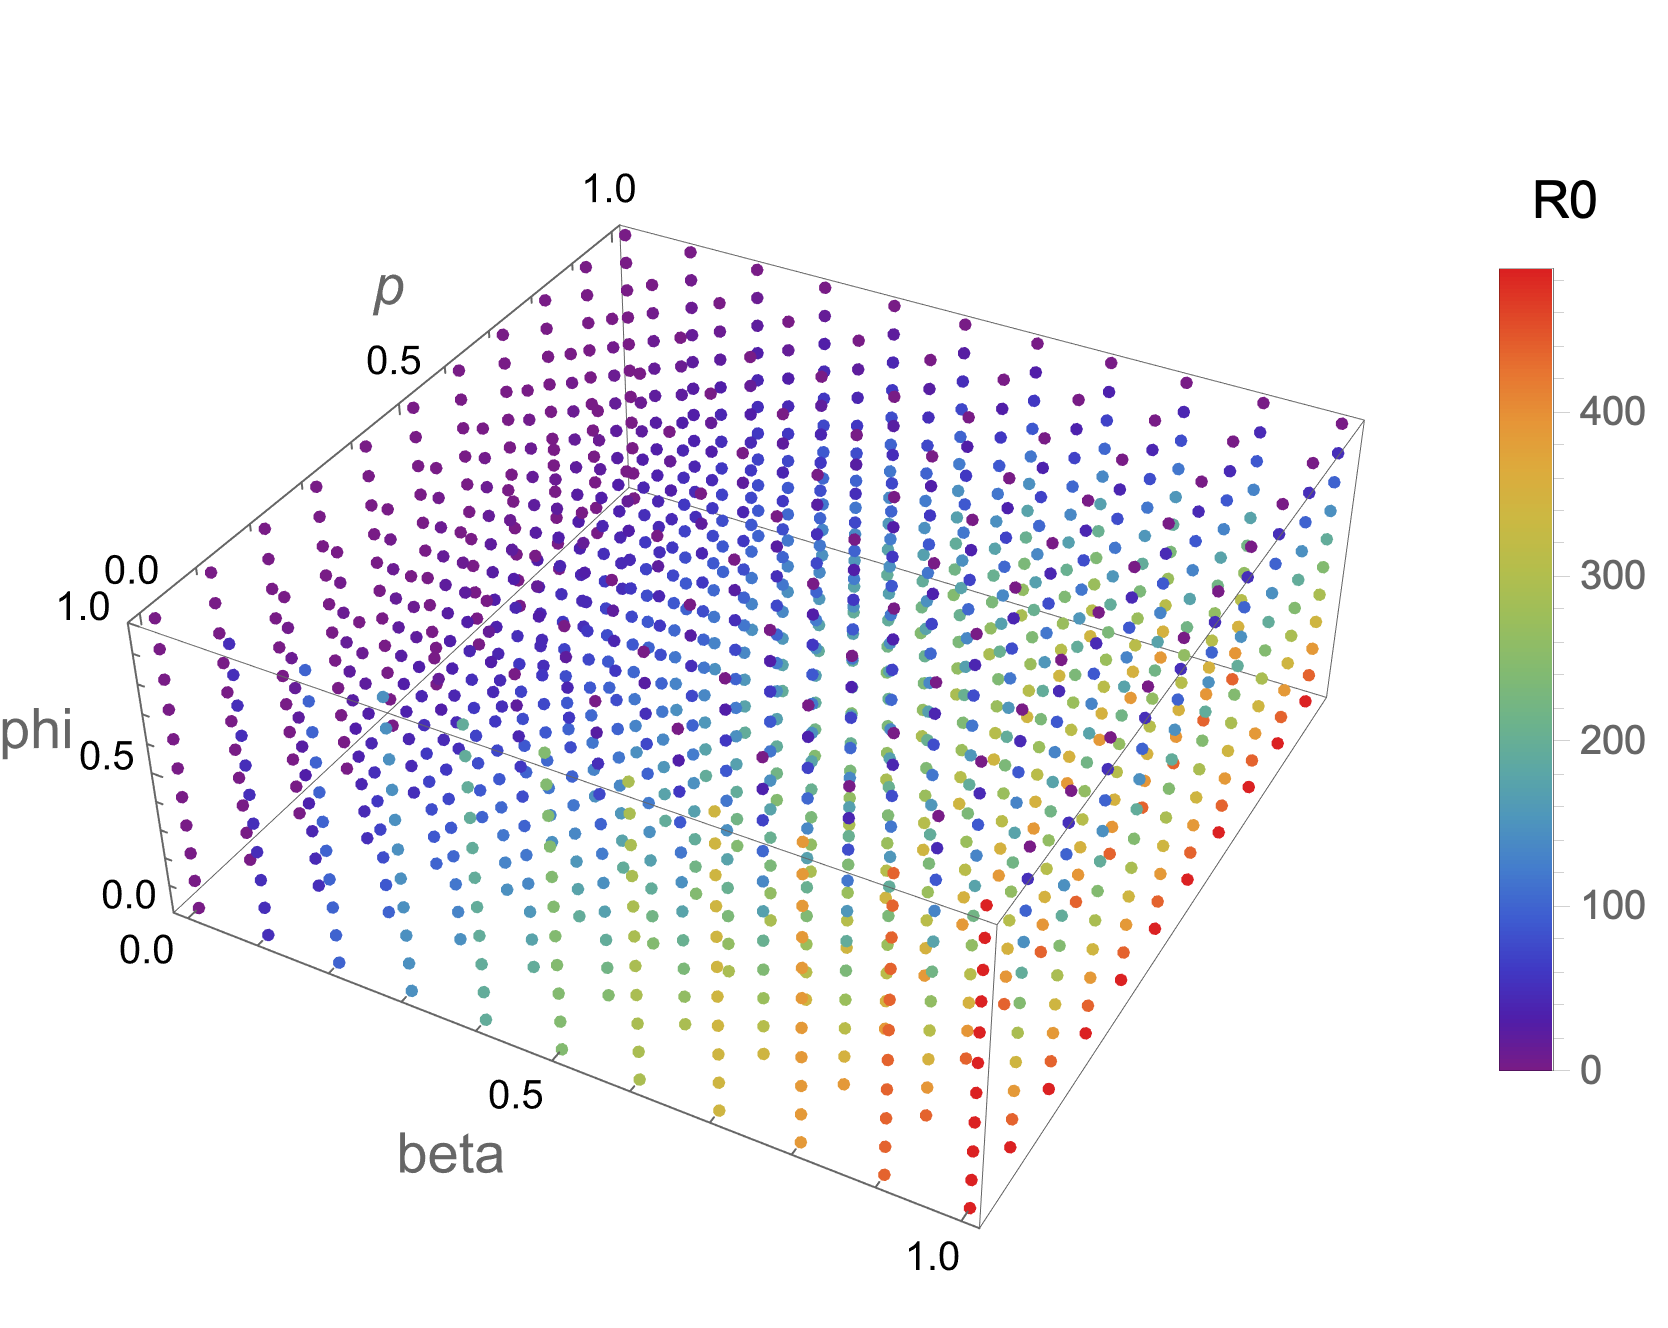
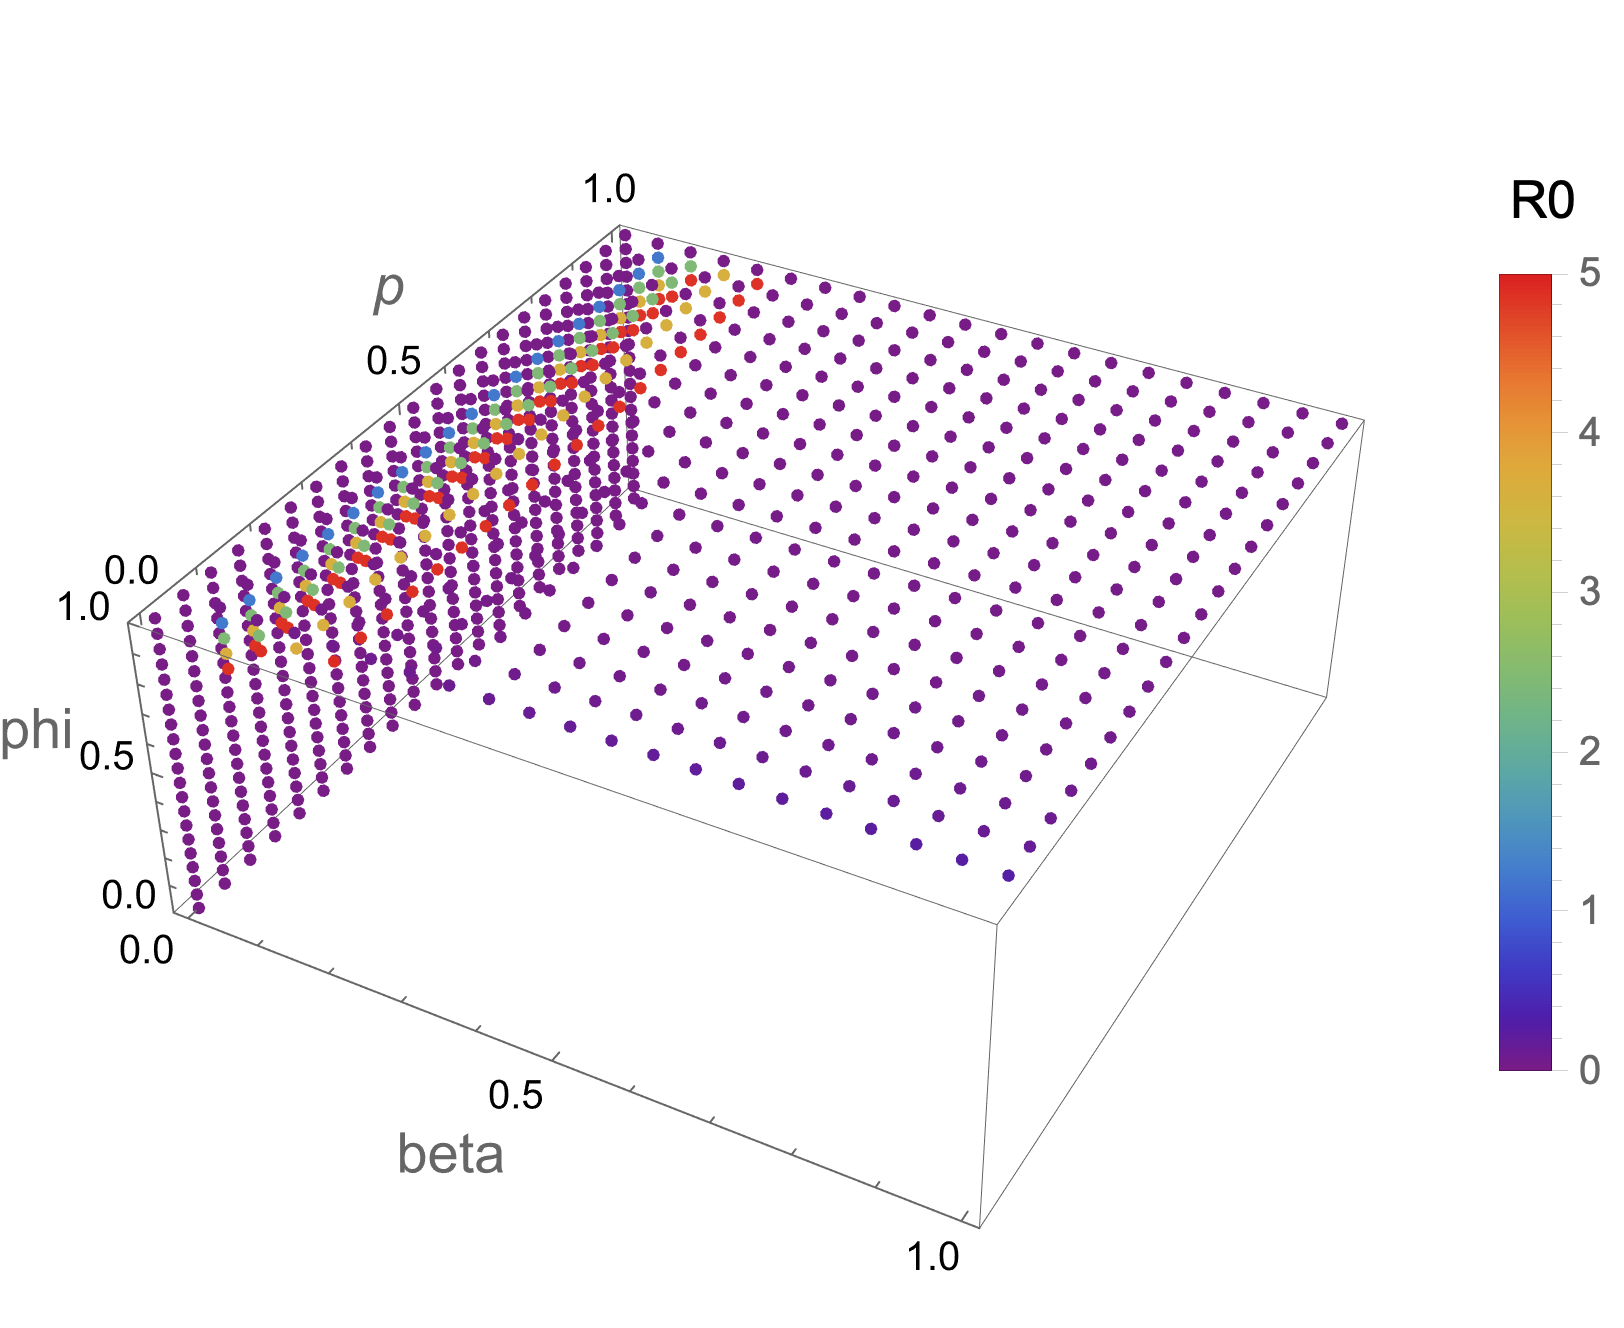
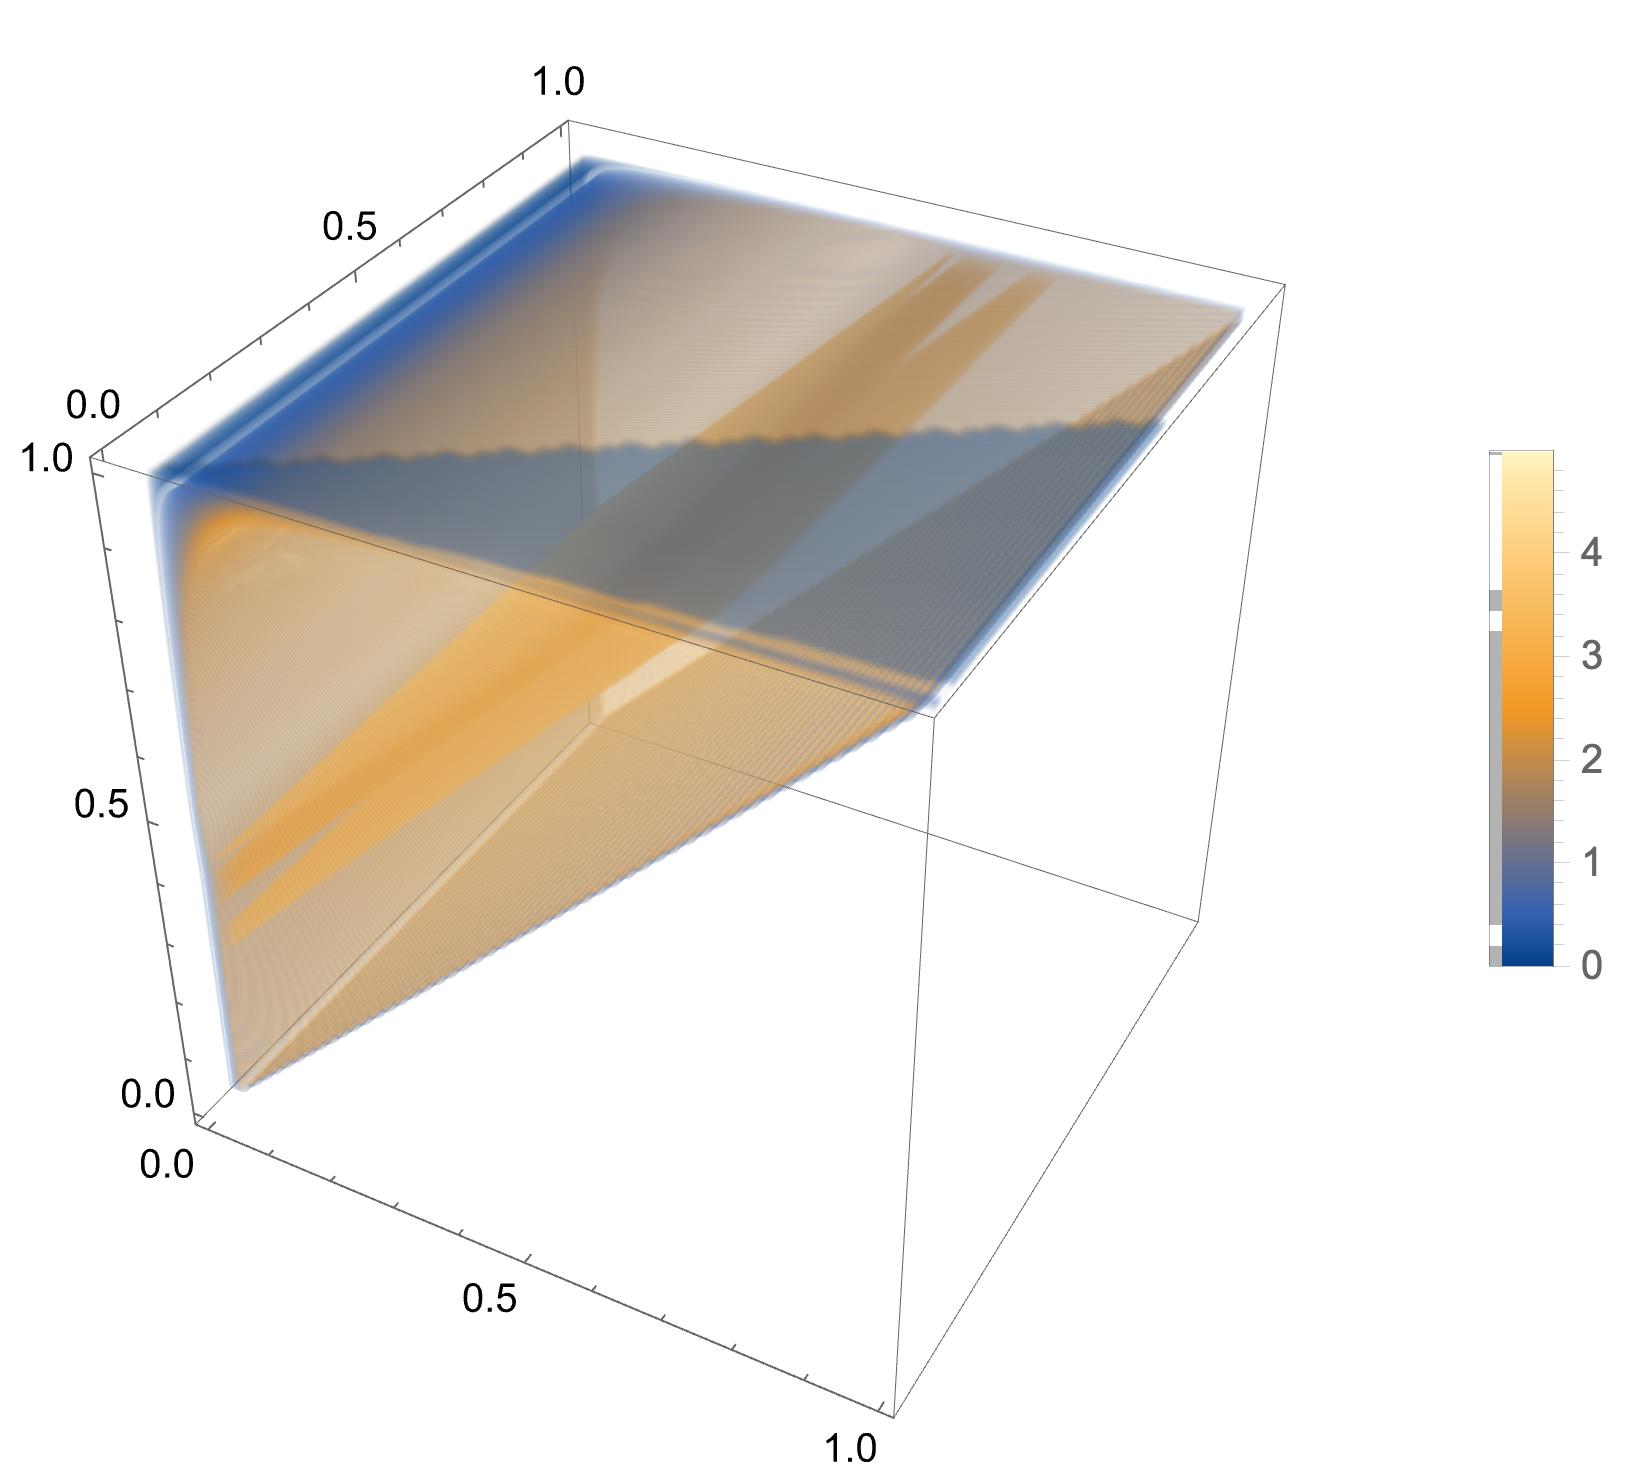
I wish to use Mathematica to plot a 4-D graph of R0 (basic reproduction number of a disease) against three given parameters in which the three parameters are represented by the x-, y-, and z- axes and R0 is represented by a color scheme. So, the graph will essentially look like a 3-dimensional graph, but the fourth dimension (illustrating R0) should be in terms of a color scheme.
In the current model, I wanted to plot R0 against the three parameters beta, p, and phi which all vary between 0 and 1. The formula for R0 and the parameters are given below.
c = 0.01;
gamma = 0.2;
theta = 0.2778;
epsilon = 0.084;
delta = 0.011;
mu = 0.000027;

R0 = (epsilon*c*beta*theta*(mu+(1-phi)*p))/(mu*(mu+p)*(mu+epsilon)*(mu+gamma+delta))
Any help on this would be highly valued. Thank you for your time!


