8
$\begingroup$

Now I'm trying to get the two-dimensional cross-section from ParametricPlot3D, the details of this question are as follows

As an example, here is a parametric equation: x=x(u,v) y=y(u,v) z=z(u,v)

We can use ParametricPlot3D to plot the surface that it describes

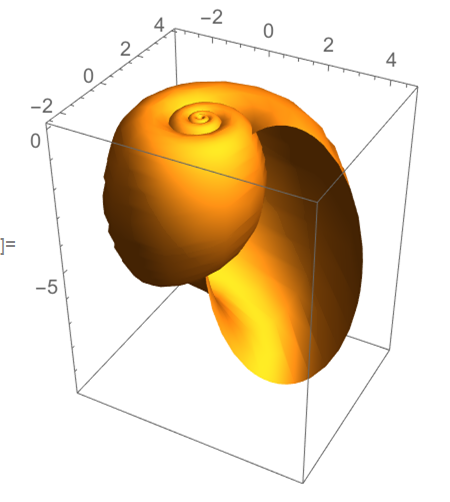
    ParametricPlot3D[{1.16^v Cos[v] (1 + Cos[u]), -1.16^v Sin[v] (1 + Cos[u]), -2 1.16^v (1 + Sin[u])}, {u, 0, 2 Pi}, {v, -15, 6}, Mesh -> False, PlotRange -> All]

3D plot

As you see, it is a 3D cube with a surface described by the equation, and the three directions of the cube represent the x, y and z axes

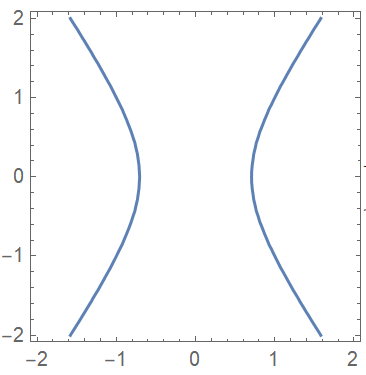
Now what I want is to generate the cross-section decided by z=constant, it is supposed be a curve in a 2D X-Y plane. So what I want is not a curve plotted in a cube, but a curve plotted on an X-Y plane, just like the picture below

2D plane

how can I do that?

Here is another question similar to mine, but the answer below can not generate a 2D graph https://stackoverflow.com/questions/10423185/cross-section-mathematica

Thank you in advance!

$\endgroup$

5 Answers 5

11
$\begingroup$

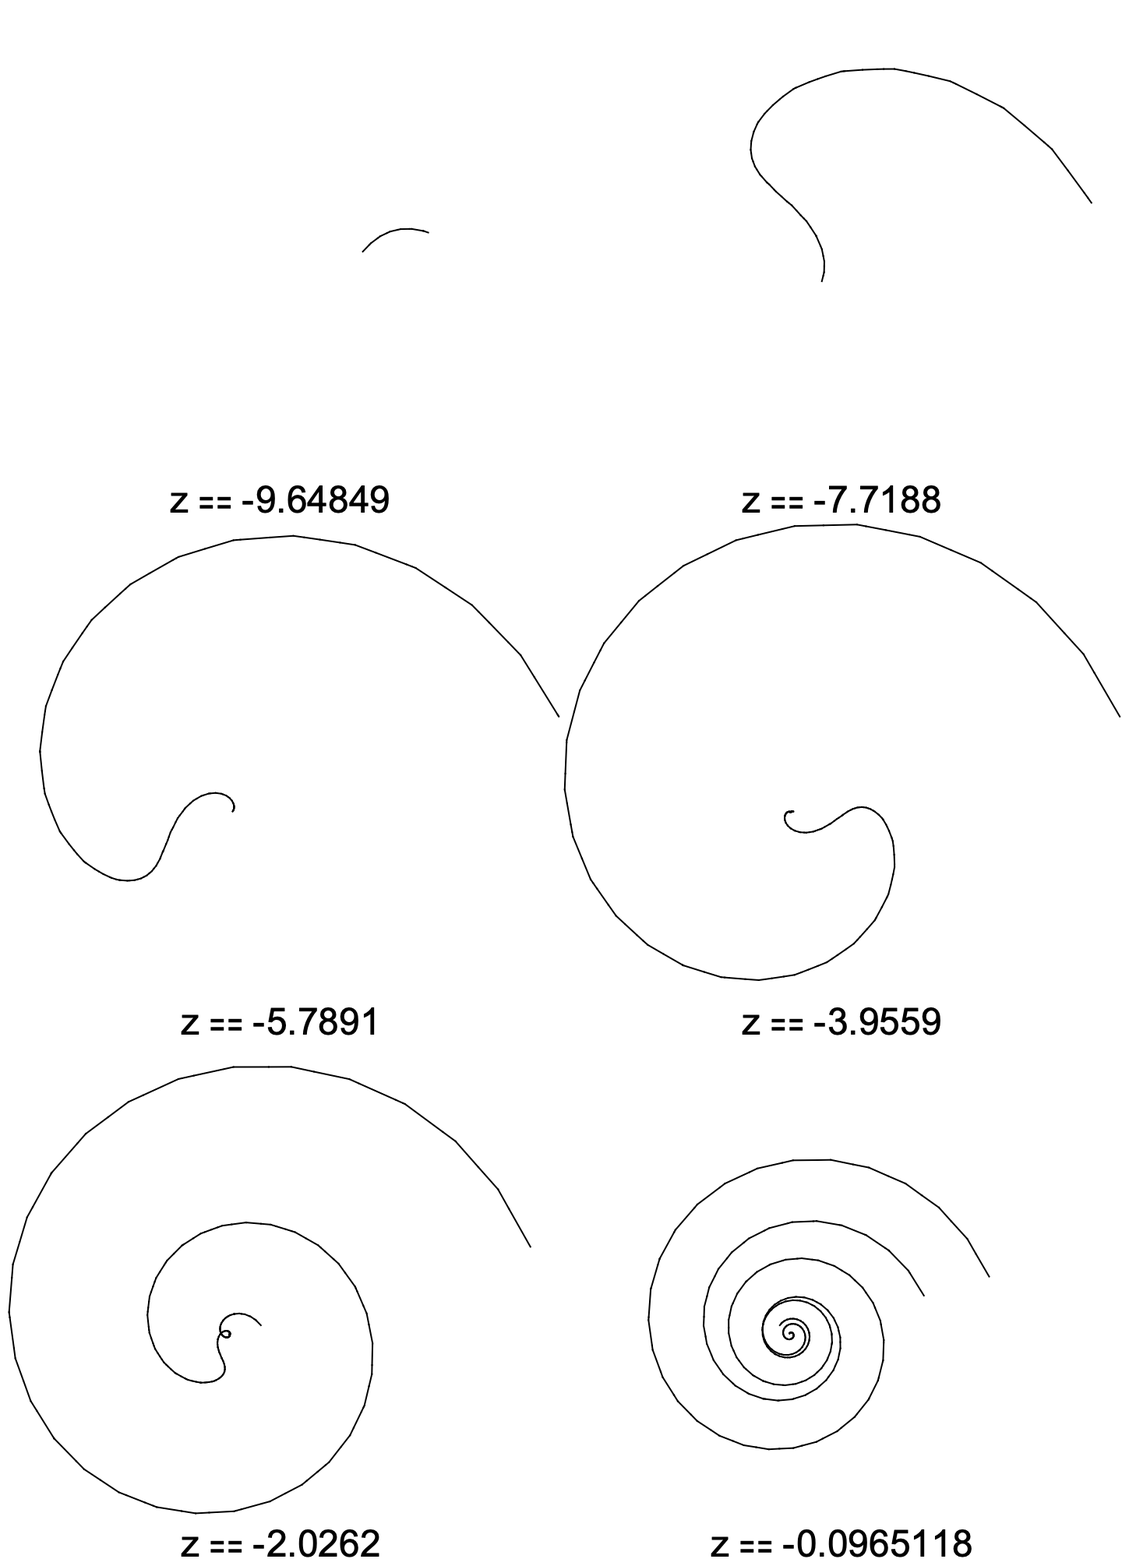
We can use the MeshFunctions options and extract the slice data accordingly.

plot = ParametricPlot3D[{1.16^v Cos[v] (1 + Cos[u]), -1.16^v Sin[v] (1 + Cos[u]), -2 1.16^v (1 + Sin[u])}, 
  {u, 0, 2 Pi}, {v, -15, 6}, MeshFunctions -> {#3 &}, Mesh -> 100, PlotRange -> All, PlotPoints -> 100];

mr = DiscretizeGraphics[plot, _Line];

bds2d = Most[PlotRange[plot]];

zcuts3d = RegionUnion @@@ GatherBy[
  SortBy[ConnectedMeshComponents[mr], RegionBounds[#][[3]]&], RegionBounds[#][[3]]&];

zcuts = Map[
  RegionBounds[#][[3, 1]] -> MeshRegion[MeshCoordinates[#][[All, 1 ;; 2]], MeshCells[#, 1]]&,
  zcuts3d
];

Manipulate[
  Labeled[
    MeshRegion[#2, MeshCellStyle -> {0 -> None, 1 -> Black}, PlotRange -> bds2d], 
    Text[Style[z == #1, 24]]
  ] & @@ zcuts[[i]], 
  {i, 1, Length[zcuts], 1}
]

enter image description here

$\endgroup$
3
  • $\begingroup$ Thanks for your help, I ran the above code and came out with a message "Part specification cuts3d[[1]] is longer than depth of object", how can I solve it? $\endgroup$
    – zhongwt
    Commented Jan 11, 2023 at 3:00
  • $\begingroup$ the "cuts3d" in the code should be "zcuts3d" $\endgroup$
    – zhongwt
    Commented Jan 11, 2023 at 7:49
  • $\begingroup$ Thanks for spotting the typo! $\endgroup$
    – Greg Hurst
    Commented Jan 11, 2023 at 14:38
8
$\begingroup$

With z constant, the third term in your parametrized vector is equal to said constant and defines a relationship between the parameters u and v.

zValue == -2 1.16^v (1 + Sin[u])

We can use that relationship to get x/y coordinates that are defined by only one parameter.

With[{zValue = -2},
 rules = 
  Solve[zValue == -2 1.16^v (1 + Sin[u]) && 
    0 <= u <= 2 Pi && -15 <= v <= 6, v];
 ParametricPlot[{1.16^v Cos[v] (1 + Cos[u]), -1.16^v Sin[
      v] (1 + Cos[u])} /. rules, {u, 0, 2 Pi}, Mesh -> False, 
  PlotRange -> All, PlotPoints -> 50]]

enter image description here

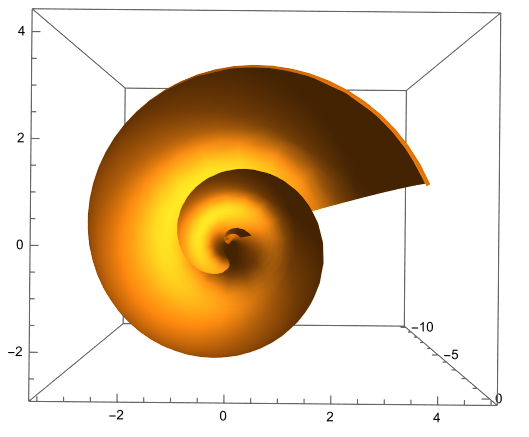
Which we can compare to the cut 3D plot.

cuttingPlane = InfinitePlane[{{0, 0, -2}, {0, 1, -2}, {1, 0, -2}}];
ParametricPlot3D[{1.16^v Cos[v] (1 + Cos[u]), -1.16^v Sin[
    v] (1 + Cos[u]), -2 1.16^v (1 + Sin[u])}, {u, 0, 2 Pi}, {v, -15, 
  6}, Mesh -> False, PlotRange -> All, PlotPoints -> 50,
 ClipPlanes -> cuttingPlane, ViewPoint -> {0, 0, 2}]

enter image description here

$\endgroup$
8
$\begingroup$
Clear["Global`*"]

{fx, fy, fz} = {
   (29/25)^v Cos[v] (1 + Cos[u]),
   -(29/25)^v Sin[v] (1 + Cos[u]),
   -2 (29/25)^v (1 + Sin[u])};

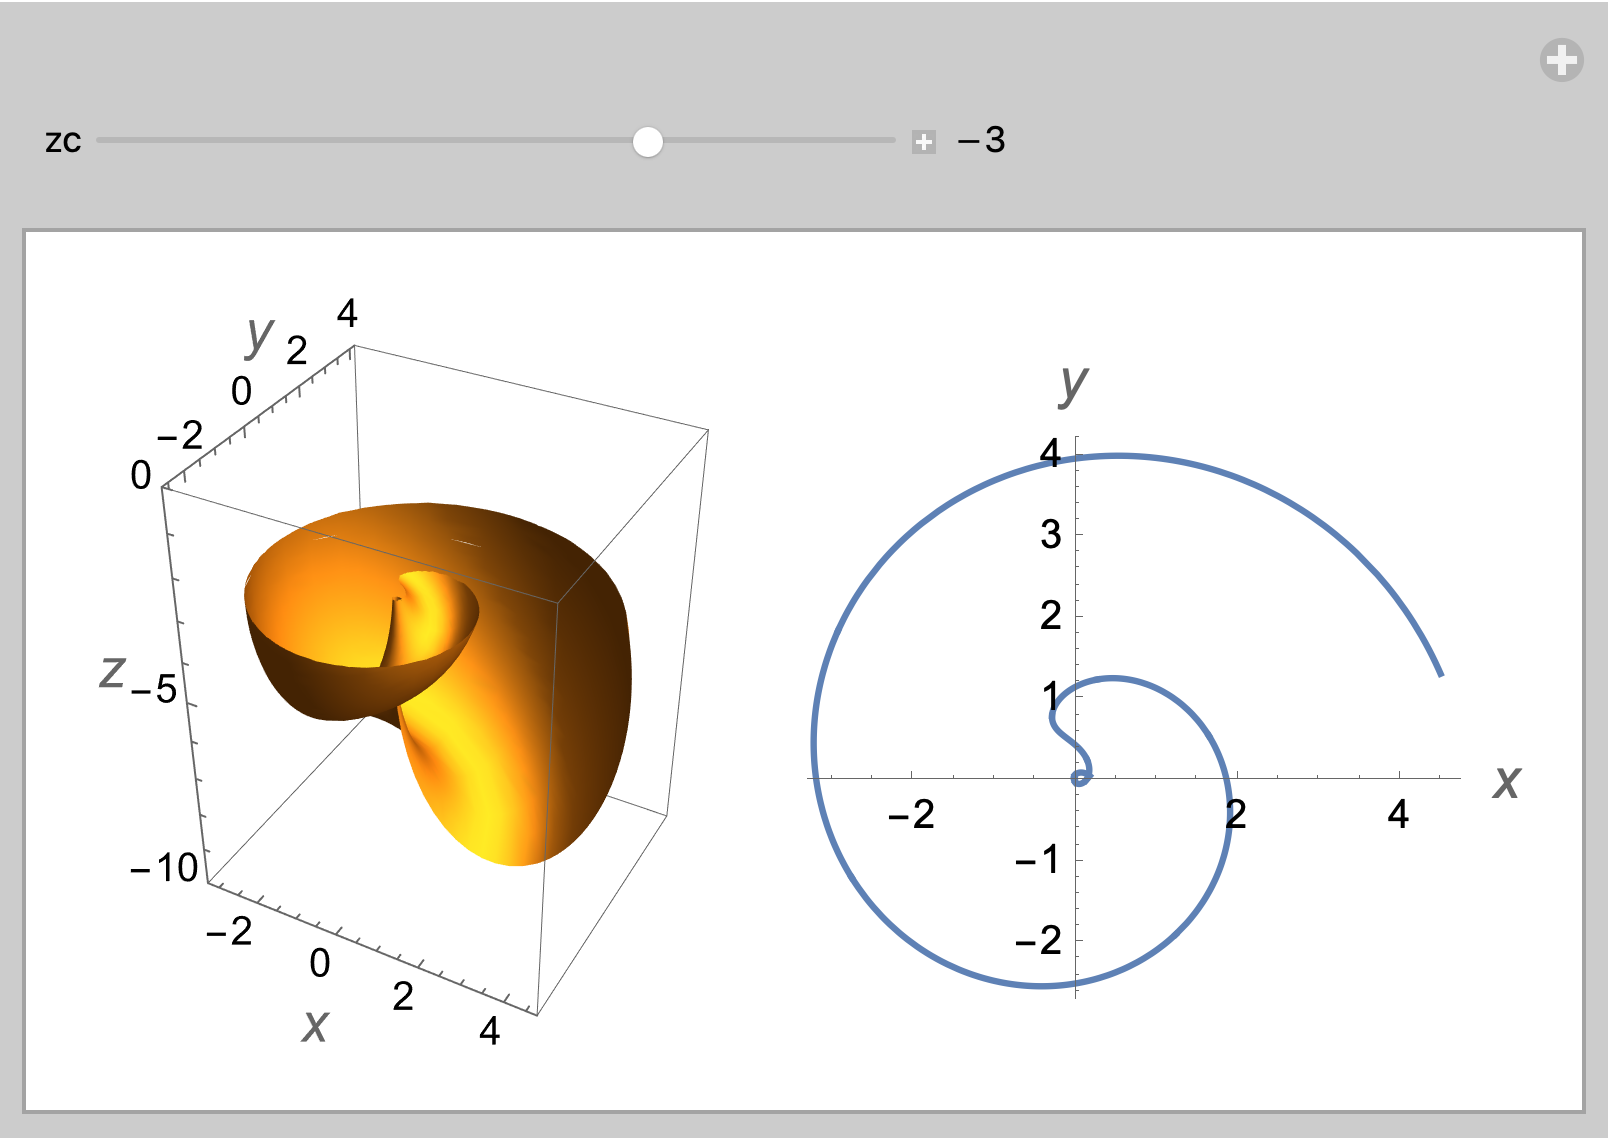
The values of v for which z has a constant value of zc are given by

vValue[u_, zc_] = Solve[{fz == zc,
     0 <= u <= 2 Pi, -15 <= v <= 6}, v, Reals][[1]] //
  Simplify[#, {0 <= u <= 2 Pi, -15 <= v <= 6}] &

enter image description here

Manipulate[
 Row[{
   ParametricPlot3D[{fx, fy, fz},
    {u, 0, 2 Pi}, {v, -15, 6},
    Mesh -> False,
    PlotRange ->
     {{-3.3, 4.75}, {-2.7, 4.2}, {-10, 0}},
    PlotPoints -> 50,
    MaxRecursion -> 3,
    AxesLabel -> (Style[#, 14] & /@ {x, y, z}),
    ImageSize -> Small,
    RegionFunction -> (#3 < zc &)],
   ParametricPlot[
    Evaluate[Simplify[
      {fx, fy} /. vValue[u, zc]]],
    {u, 0, 2 Pi},
    Exclusions -> {u == 3 Pi/2},
    Mesh -> False,
    PlotRange -> {{-3.3, 4.75}, {-2.7, 4.2}},
    PlotPoints -> 100,
    MaxRecursion -> 5,
    AxesLabel -> (Style[#, 14] & /@ {x, y}),
    ImageSize -> Small,
    Exclusions -> {u == 3 Pi/2}]}],
 {{zc, -3}, -10, 0, 0.05, Appearance -> "Labeled"}]

enter image description here

$\endgroup$
7
$\begingroup$

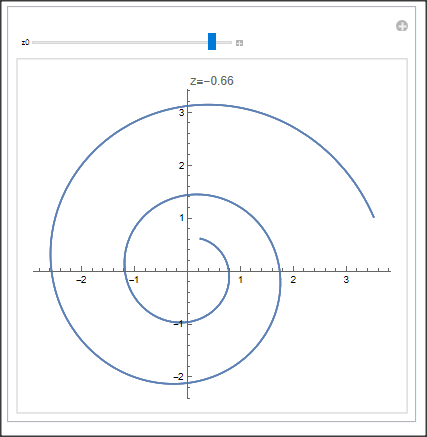
We may set the z component to a given value and then solve for e.g.u. Then we have u[v]. This then defines a line. The problem here is, that the solution is multivalued. We therefore create as many plots as needed and combine them with "Show"

disp[d0_, z0_] := Module[{cu, iter},
  {cu, iter} = 
   Cases[sol[[1, 1]], _[
       c1_, _[c2_, _, c3_, _, c4_]] -> {c1, {c3, c2, c4}}, {1}][[1]];
  ParametricPlot[Evaluate[xy /. u -> cu], Evaluate[iter], 
   PlotLabel -> StringForm["z=``", z0]]
  ]

    xy = {1.16^v Cos[v] (1 + Cos[u]), -1.16^v Sin[v] (1 + Cos[u])};
    Manipulate[
     sol = Solve[{-2 1.16^v (1 + Sin[u]) == z0, 
         0 <= u <= 2 Pi, -15 <= v <= 6}, u] // Quiet;
     Show[disp[#, z0] & /@ sol]
     , {z0, -9, 0}, TrackedSymbols :> z0]

enter image description here

$\endgroup$
6
$\begingroup$
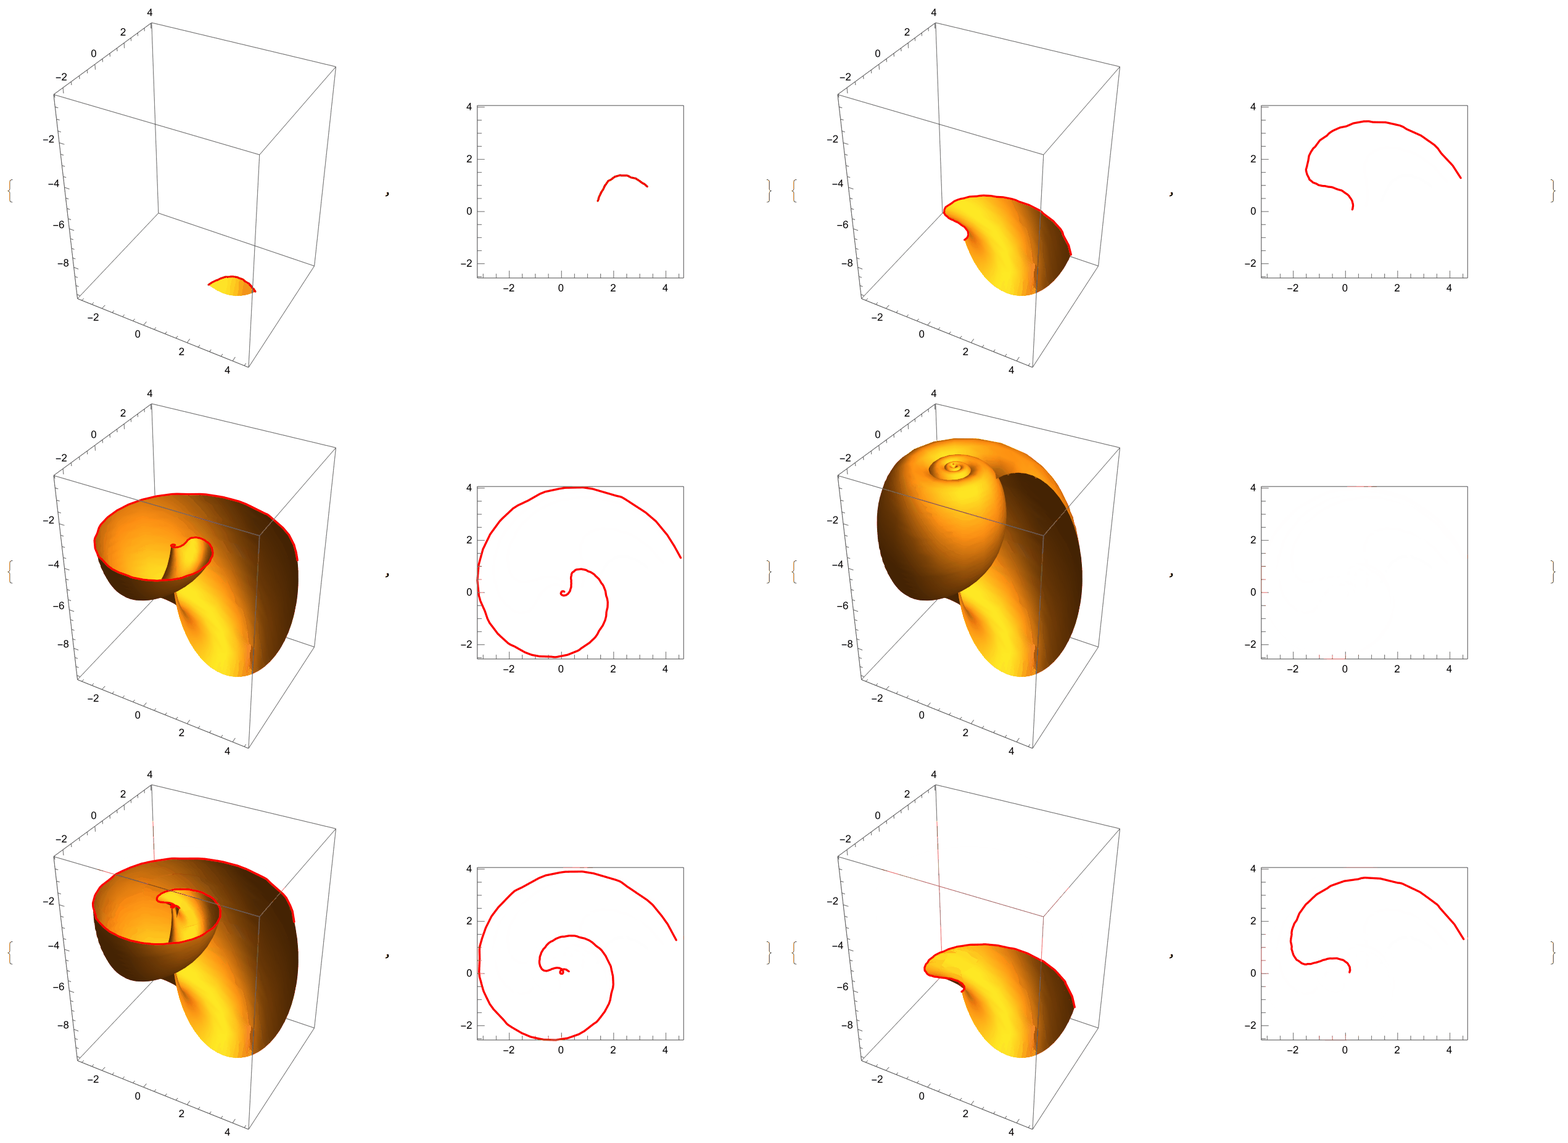
  • Also using MeshFunctions.
  • Using MeshShading -> {Automatic, None} or MeshShading -> {None, None} to remove some parts of surfaces.
Clear[f, plot, range];
f[u_, v_] = {1.16^v Cos[v] (1 + Cos[u]), -1.16^v Sin[
     v] (1 + Cos[u]), -2 1.16^v (1 + Sin[u])};
SetOptions[ParametricPlot3D, MeshFunctions -> {#3 &}, 
  PlotPoints -> 50, MaxRecursion -> 2, PerformanceGoal -> "Quality", 
  PlotRange -> range];
plot = ParametricPlot3D[f[u, v], {u, 0, 2 Pi}, {v, -15, 6}, 
   PlotRange -> All];
range = PlotRange /. AbsoluteOptions[plot, PlotRange];
Manipulate[
 Module[{plot}, 
  plot = ParametricPlot3D[f[u, v], {u, 0, 2 Pi}, {v, -15, 6}, 
    Mesh -> {{h}}, MeshStyle -> {Thick, Red}, 
    MeshShading -> {Automatic, None}, ImageSize -> Medium]; {plot, 
   Graphics[{Red, 
     Cases[Normal[
         Show[plot, PlotRange -> range, ViewPoint -> Top, 
          ViewProjection -> "Orthographic"]], Line[pts_] :> pts, 
        Infinity] /. {x_Real, y_Real, z_Real} :> {x, y} // Line}, 
    Frame -> True, ImageSize -> Medium, 
    PlotRange -> Most[range]]}], {h, Sequence @@ Last[range]}]

enter image description here

$\endgroup$
0

Your Answer

By clicking “Post Your Answer”, you agree to our terms of service and acknowledge you have read our privacy policy.

Not the answer you're looking for? Browse other questions tagged or ask your own question.