2
$\begingroup$

I want to define a function that returns True if a complex number $z$ is in complex set $\Omega $ which is the pentagon with vertices located at the fifth roots of unity, i.e. $\left\{ 1,\xi,\xi^{2},\xi^{3},\xi^{4}\right\} $ where $\xi=e^{2\pi i/5}$. Can anyone help me with code or a reference?

I would also like to plot these roots on the complex plane. Any other suggestions would be very much appreciated.

$\endgroup$

2 Answers 2

3
$\begingroup$
Clear[pts,reg,test,randompts];
pts = Table[Exp[2 k*π*I/5], {k, 0, 4}];
reg = Polygon[ReIm[pts]];
test[z_] = RegionMember[reg]@ReIm@z;
randompts = RandomComplex[1 + I, 5];
test /@randompts
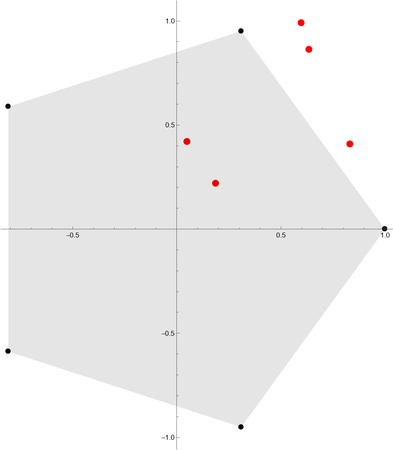
ComplexListPlot[{pts, randompts}, Epilog -> {{Opacity[.1], reg}}, 
 PlotStyle -> {Black, {AbsolutePointSize[10], Red}}]

enter image description here

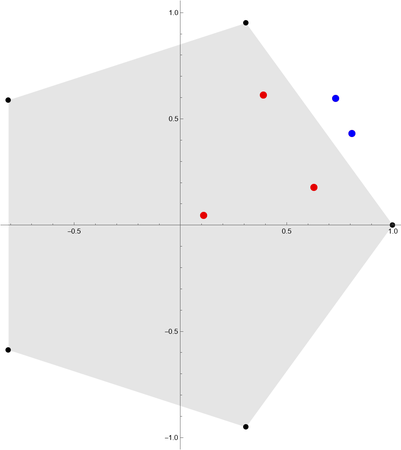
  • distinguish the color of the point if the random point inside or outside of the region.
ComplexListPlot[{pts, 
  If[test[#], Style[#, Red], Style[#, Blue]] & /@ randompts}, 
 Epilog -> {{Opacity[.1], reg}}, 
 PlotStyle -> {Black, {AbsolutePointSize[10], Red}}]

enter image description here

$\endgroup$
1
  • $\begingroup$ Do you also know How can I plot the random number? $\endgroup$
    – Dac0
    Commented Oct 11, 2022 at 12:50
3
$\begingroup$
SeedRandom[1];
roots = Solve[z^5 == 1, Complexes]
reg = ConvexHullRegion[z /. roots // ReIm]
r1 = Rectangle[{-1.5, -1.5}, {1.5, 1.5}];
RegionQ /@ {reg, r1}
randomPts = RandomPoint[r1, 30]; (*inside a rectangular region*)
ptsInsideRegion = Select[randomPts, RegionMember[reg, #] &];
ptsOutsideRegion = Select[randomPts, ! RegionMember[reg, #] &];

Show[
 RegionPlot[reg
  , PlotStyle -> Directive[{Opacity[0.3], Cyan, reg}]
  , PlotLegends -> Placed[PointLegend[
     {Red, Black, Orange, Cyan, Gray}
     , {"Roots", "Outside", "Inside", "Region", "Rectangle"}]
    , {1.05, 0.5}
    ]
  ],
 ComplexListPlot[z /. roots,
  PlotStyle -> Directive[AbsolutePointSize[8], Red]]
 , Epilog -> {
   {Opacity[0.1], r1}
   , AbsolutePointSize[5], Black
   , Point@ptsOutsideRegion
   , AbsolutePointSize[5], Orange
   , Point@ptsInsideRegion
   }
 , Axes -> True
 , GridLines -> Automatic
 , GridLinesStyle -> {{Dotted, Gray}, {Dotted, Gray}}
 , PlotRange -> {{-2, 2}, {-2, 2}}
 ]
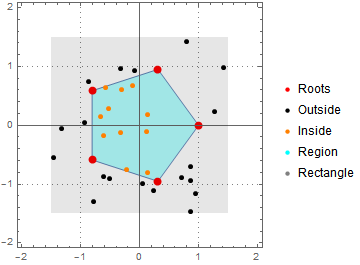
enter image description here

$\endgroup$
0

Your Answer

By clicking “Post Your Answer”, you agree to our terms of service and acknowledge you have read our privacy policy.

Not the answer you're looking for? Browse other questions tagged or ask your own question.