0
$\begingroup$

Suppose that I have a continuous function $f: [-1,1] \to \mathbb{R}$, such that $f(0) =1$. We denote with $f_+$ the function that coincides with $f$ between its first non-positive and positive roots, and vanish (i.e. it it set equal to zero) everywhere else.

  1. Is there some simple way to plot $f_+$ in Mathematica without having to determine numerically the roots of $f$?

  2. Is there some simple way to integrate numerically $f_+$ over [-1,1]?

(f can be any continuous function, take for example f(x) = sin(10x) if you wish)

UPDATE: added one further question

$\endgroup$
3
  • $\begingroup$ Look for RegionFunction $\endgroup$ Commented Sep 16, 2022 at 8:44
  • 1
    $\begingroup$ Please post the expression of such function. $\endgroup$
    – cvgmt
    Commented Sep 16, 2022 at 9:18
  • $\begingroup$ When you say vanish, does it mean it goes to 0, $-\infty$ or it simply disappears from the screen? $\endgroup$
    – Syed
    Commented Sep 16, 2022 at 9:32

2 Answers 2

2
$\begingroup$

Edit

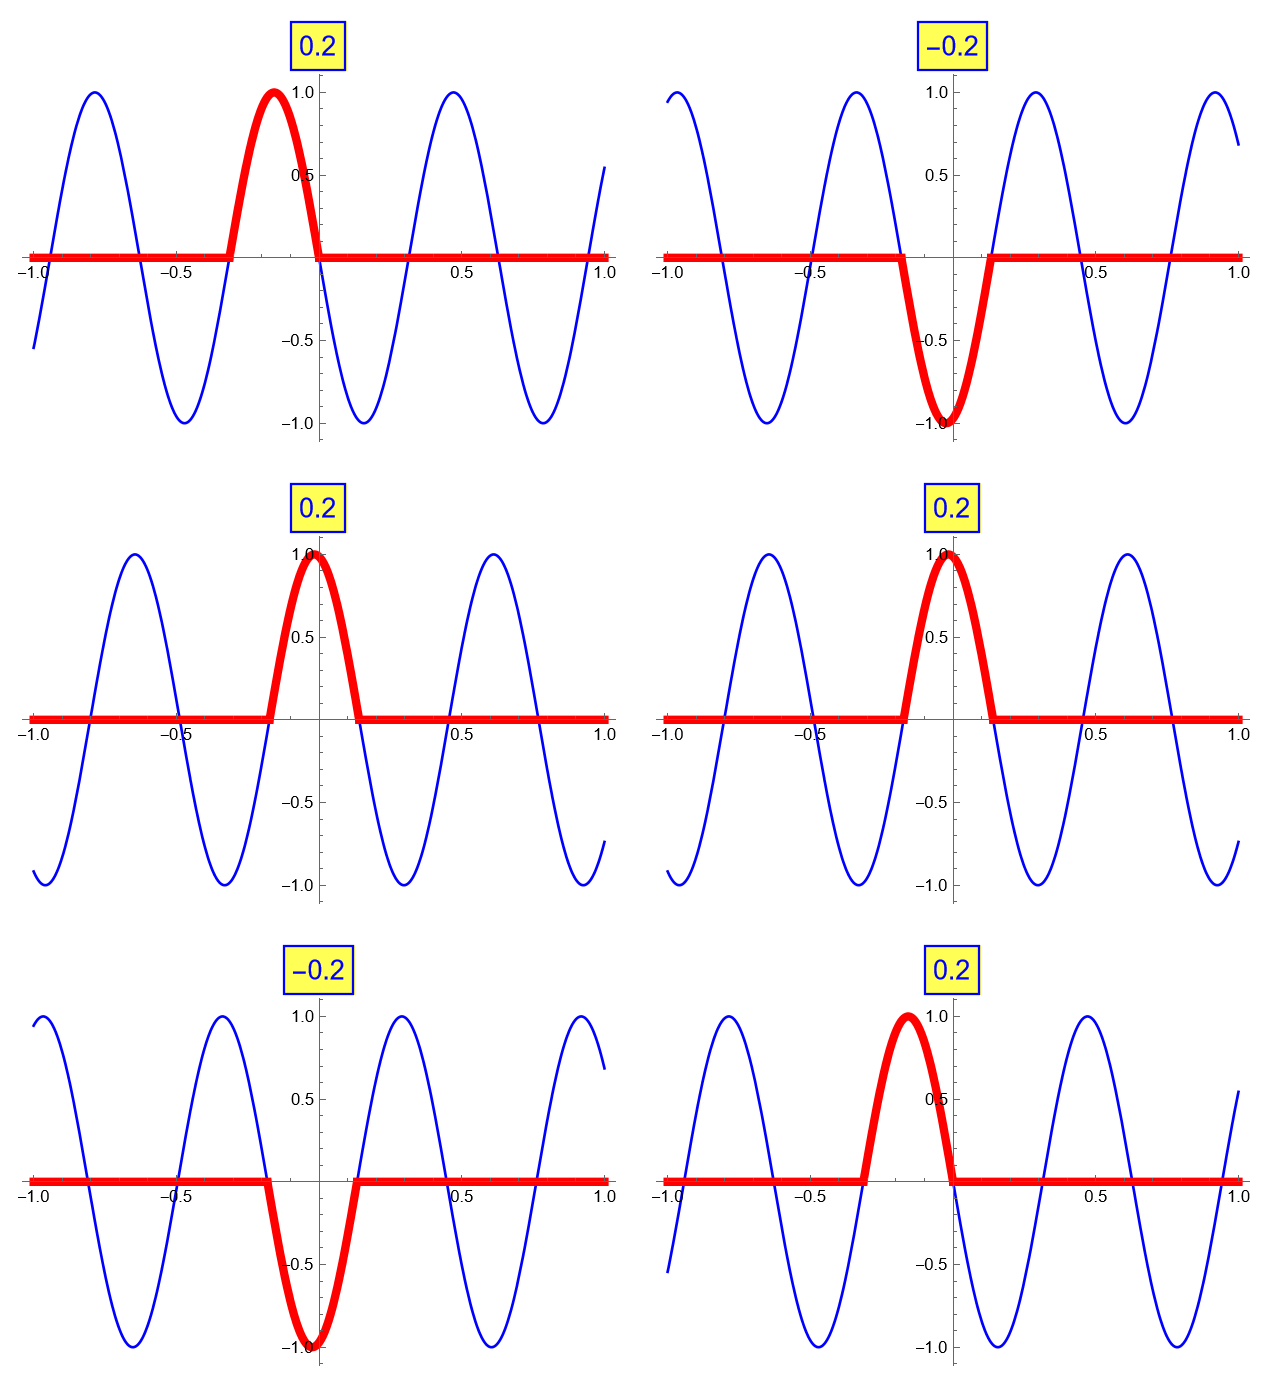
Manipulate[Module[{f, roots, a, b, f1, int},
  f[x_, c_] = Sin[10 (x + c *\[Pi]/20)];
  roots = SplitBy[NSolveValues[{f[x, c] == 0, -1 <= x <= 1}, x], Sign];
  a = roots[[1, -1]];
  b = roots[[2, 1]];
  f1[x_, c_] = Piecewise[{{f[x, c], a <= x <= b}}, 0];
  int = NIntegrate[f1[x, c], {x, a, b}];
  Plot[{f[x, c], f1[x, c]}, {x, -1, 1}, 
   PlotStyle -> {Blue, Directive[Red, AbsoluteThickness[5]]}, 
   PlotLabel -> 
    Style[Framed[ToString[int]], 16, Blue, 
     Background -> Lighter[Yellow]]]], {c, -2, 2}]

enter image description here Original

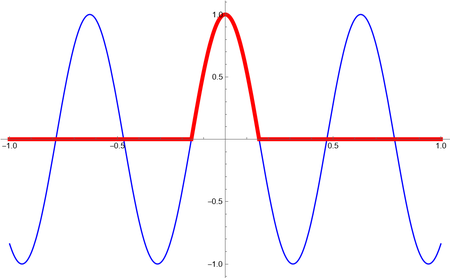
Clear[f,roots,a,b,f1];
f[x_] = Sin[10 (x + π/20)];
roots = SplitBy[NSolveValues[{f[x] == 0, -1 <= x <= 1}, x], Sign]
a = roots[[1, -1]]
b = roots[[2, 1]]
f1[x_] = Piecewise[{{f[x], a <= x <= b}}, 0];
Plot[{f[x], f1[x]}, {x, -1, 1}, 
 PlotStyle -> {Blue, Directive[Red, AbsoluteThickness[5]]}]
NIntegrate[f1[x], {x, a, b}]

enter image description here

$\endgroup$
3
  • $\begingroup$ That's very close to what I need, but not yet so. $f_+$ is the part between the FIRST non-positive root and the FIRST postive root (the rest being set to zero). In your example, one should also put to zero all the values for x \leq -0.2something (i.e. where the first negative zero is locate) $\endgroup$
    – Raziel
    Commented Sep 16, 2022 at 13:57
  • $\begingroup$ @Raziel Do you mean the interval between the largest non-positive root ans the smallest positive root? $\endgroup$
    – cvgmt
    Commented Sep 16, 2022 at 14:07
  • $\begingroup$ Yes, exactly. My function also depends on extra parameters, and I would like also to "Manipulate" over those parameters. Is this possible? Say: f[x_] = Sin[10 (x + a π/20)], where a is the parameter $\endgroup$
    – Raziel
    Commented Sep 16, 2022 at 14:22
0
$\begingroup$

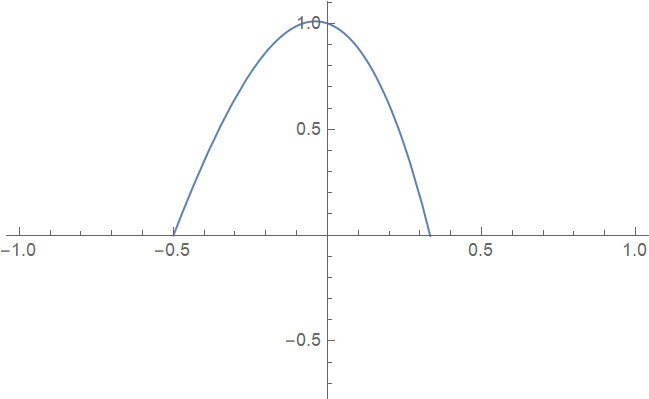
Try RegionFunction inside Plot-command:

f = Function[x, -3 (x + 1/2) (x - 1/3) (x + 2)];
(* examplary funtion*)
Plot[f[x], {x, -1, 1}, RegionFunction -> Function[x, f[x] >=  0]] 

enter image description here

$\endgroup$
2
  • $\begingroup$ This plots the positive part of the function, which is different from what I asked. P.S. I also added a second question. $\endgroup$
    – Raziel
    Commented Sep 16, 2022 at 12:54
  • $\begingroup$ @Raziel Without knowing the roots one can not do more I think. $\endgroup$ Commented Sep 16, 2022 at 13:02

Your Answer

By clicking “Post Your Answer”, you agree to our terms of service and acknowledge you have read our privacy policy.

Not the answer you're looking for? Browse other questions tagged or ask your own question.