3
$\begingroup$

Suppose I try to run the following code:

f[x_] := Cos[x]
F[X_] := Normal[Series[f[x], {x, X, 5}]]
Plot[Table[F[n], {n, -5, 5, 1}], {x, -Pi, Pi}]

Mathematica will give me a series of errors like:

General::ivar: -3.14146 is not a valid variable.

General::stop: Further output of General::ivar will be suppressed during this calculation.

But I can solve it writing:

f[x_] := Cos[x]
F[X_] := Evaluate@Normal[Series[f[x], {x, X, 5}]]
Plot[Table[F[n], {n, -5, 5, 1}], {x, -Pi, Pi}]

I suspect that what happens in the first case is that Mathematica tries to substitute every $x$ in Normal[Series[f[x], {x, X, 5}]] by $-\pi$ in which case, this yields: Normal[Series[f[-Pi], {-Pi, X, 5}]]which is nonsense. But if I try:

f[x_] := Cos[x]
F[X_] := Plot[f[x], {x, 0, 2 Pi}]
Table[F[n], {x, -1, 1, 1}]

This doesn't yield any problems. By running:

Attributes[Plot]
Attributes[Normal]
Attributes[Series]

I get:

{HoldAll, Protected, ReadProtected}
{Protected}
{Protected}

So I suspect that it is the attribute "HoldAll" that is changing the order of computation here. Reading the help files about HoldAll, it says:

is an attribute that specifies that all arguments to a function are to be maintained in an unevaluated form.

It's not clear to me what this means. Does it means that HoldAll does what Evaluate does in the example I provided?

$\endgroup$
1
  • $\begingroup$ In addition to the documentation for HoldAll, you should also read the Non-Standard Evaluation tutorial. $\endgroup$
    – user293787
    Commented Aug 10, 2022 at 8:17

2 Answers 2

4
$\begingroup$

There's a bit of a long road here. Let's start simple. Let's define these two functions (identical implementation), but let's set HoldAll for one of them.

SetAttributes[funcA, HoldAll];
funcA[expr_] := Head@Unevaluated[expr];
funcB[expr_] := Head@Unevaluated[expr]

Now let's try them out.

funcA[1 + 2] (*Plus*)
funcB[1 + 2] (*Integer*)

What happened for funcB is something like this:

funcB[1+2]
funcB[3]
Head@Unevaluated[3](*Head sort of doesn't "know" about the Unevaluated*)
Integer

What happened for funcA is something like this:

funcA[1+2]
(*HoldAll prevents evaluation of 1+2*)
Head@Unevaluated[1+2](*Again, weirdness, Head looks right at 1+2*)
Plus

Why the need for Unevaluated in the definitions? Well, expr will be passed unevaluated, but then normal evaluation takes over. So, in our case there would be no noticeable difference between funcA and funcB even though their evaluation steps would be slightly different. Anyway, that's what HoldAll does. It interrupts what would be normal sequence of evaluation for the arguments to the function with the HoldAll attribute.

Plot needs to hold its arguments, because if the function you wanted to plot were just immediately evaluated, then you'd lose the "structure" of the function you wanted to plot. It might evaluate to something like a number right away, and now you can't do the substitutions necessary to generate the points that make up the plot. I'm sure Plot is a special case and that it's more complicated than what I've just described, but that's the gist.

Now to your specific case. In your definition

F[X_] := Normal[Series[f[x], {x, X, 5}]]

the variable x is just haning out there in the global context. If one were to evaluate x=5, your F function would produce unexpected results (specifically an error, because we expect that range specification to start with a variable, not an integer).

Now, we'd have to trace through carefully, but I think that's pretty much exactly what's happening in your Plot. The Table expression is held unevaluated until it's needed. We set x=-Pi to start off the plot. Now we evaluate your Table which in turn evaluates your F and lo and behold, there's our x which we've already defined (within the scope of the plot) to be -Pi, and oops, we have an error.

In these situations, you'll often see an Evaluate injected into the Plot, like this:

Plot[Evaluate[Table[F[n], {n, -5, 5, 1}]], {x, -Pi, Pi}]

(which works, by the way). We force the first argument to evaluate itself. Any undefined x along the way will remain unevaluated, and so we have an expression that's "ready" for the replacements that Plot wants to do.

$\endgroup$
2
$\begingroup$

This is one case where you want to define your F function through immediate evaluation using Set (=) rather than through the more usual delayed evaluation using SetDelayed (:=). If you do that, then the Series will be calcuated once and for all at definition time, and then Plot won't have a problem when making the necessary substitutions:

Clear[f, F]
f[x_] := Cos[x]
F[X_] = Normal[Series[f[x], {x, X, 5}]]

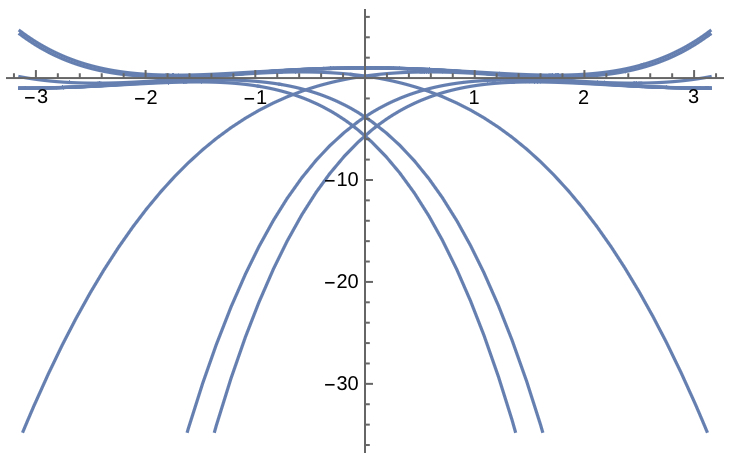
Plot[Table[F[n], {n, -5, 5, 1}], {x, -Pi, Pi}]

plot works, but all curves are same color


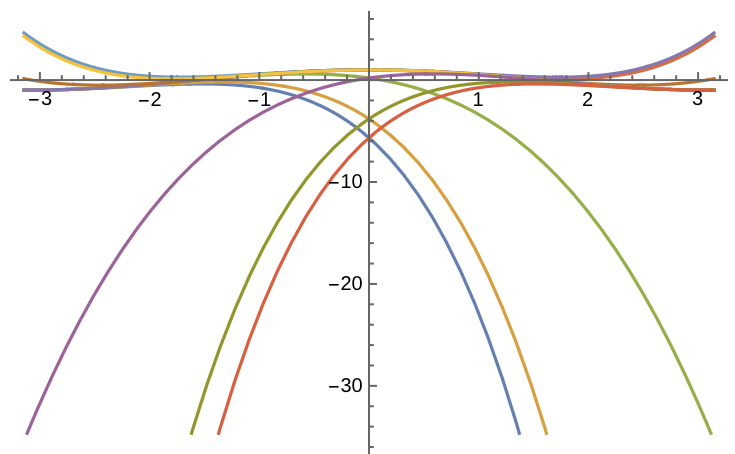
As you can see, that's not quite satisfactory yet: you probably want each curve to be colored differently! This is a separate issue, this one definitely linked with the Hold attribute of plotting functions, as explained in Plot draws list of curves in same color when not using Evaluate. The solution is to force evaluation of the Table to an explicit List, so Plot can "see" this structure and will color each entry differently:

Plot[Evaluate@ Table[F[n], {n, -5, 5, 1}], {x, -Pi, Pi}]

same plot, each curve colored differently

$\endgroup$

Your Answer

By clicking “Post Your Answer”, you agree to our terms of service and acknowledge you have read our privacy policy.

Not the answer you're looking for? Browse other questions tagged or ask your own question.