3
$\begingroup$

I have a plot generated with RegionPlot3D and need to extract the coordinates of the points on the plot. I'm trying to apply the approach from this question about RegionPlot to RegionPlot3D but it doesn't seem to be working. Any suggestions would be highly appreciated.

I am also open for any other suggestions on how to extract the coordinates. Ideally I want as many as possible and in csv (I need to pass it to the Elsevier visualisation tool)

region3d = Normal@RegionPlot3D[x^2 + y^2 + z^2 <= 1, {x, -1, 1}, {y, -1, 1}, {z, -1, 1}]

pts = DeleteDuplicates@Flatten[Cases[region3d, Polyhedron[x_, y_] :> {x, y}, Infinity], 1]

The last lines gives an empty list and I'm not sure how to fix it. I suppose the problem is with Polyhedron.

$\endgroup$

2 Answers 2

5
$\begingroup$

RegionPlot3D produces a GraphicsComplex, whose first argument is the list of coordinates. So you can use

pts = RegionPlot3D[x^2 + y^2 + z^2 <= 1, {x, -1, 1}, {y, -1, 1}, {z, -1, 1}][[1, 1, 1]];

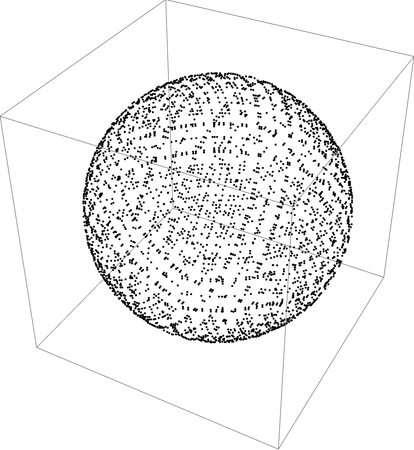
You can then export these points, e.g., to a csv file. Or plot them, e.g.,

ListPointPlot3D[pts, BoxRatios -> {1, 1, 1}]

enter image description here

$\endgroup$
4
$\begingroup$
pts1=Cases[region3d, Line[pts_] :> pts, Infinity]

Or

pts2 = DeleteDuplicates@
  Cases[region3d, Polygon[{pts__}, Rule[VertexNormals, __]] :> pts, 
   Infinity]
Graphics3D[Point@pts2]

enter image description here

$\endgroup$

Your Answer

By clicking “Post Your Answer”, you agree to our terms of service and acknowledge you have read our privacy policy.

Not the answer you're looking for? Browse other questions tagged or ask your own question.