1
$\begingroup$

I need to compute annual mean interest rates from public data. FRED mortgage rate data (available here: https://fred.stlouisfed.org/series/MORTGAGE30US) when downloaded as an Excel file, Imports as pairs {date,rate} thus image of part of data from Fred

The data available from Fred is 1971 to the present; I am only interested in 1990-2021, inclusive. This code works fine to create a 1670 obs dataset for the 32 year period of interest

    intDates = Select[intRates[[All, 1]],DateObject[{1989, 12, 31, 0, 0, 0}] < # <   DateObject[{2022, 1, 1, 0, 0, 0}] &]; 
intVals = intRates[[980 ;; 2649]][[All, 2]]; 
intData = Transpose[{intDates, intVals}]; 
intData // Length

Problemo: 1670/52 is not an integer. BECAUSE, the Fed produces a value weekly on the same day and some years have 52 readings and some have 53. I would rather not arbitrarily drop data. In my segment of time there are 6 years with 53 readings. One would think, since the code above works fine, this code...

    tbl = Transpose[Table[{i, i + 2}, {i, 1989, 2020}]];
reads = MapThread[
   Select[intRates[[All, 1]], 
     DateObject[{#1, 12, 31, 0, 0, 0}] < # < 
      DateObject[{#2, 1, 1, 0, 0, 0}]] &, tbl];
Length[#]&/@reads

...would also, where the strategy is to measure the read count for each year with a year being defined as a period greater than New Year's Eve from the prior year and less than New Year's Day of the following year. But something about DateObject does not cooperate.

I am more than happy to upload my Excel file but have been unable to locate the mechanism for doing so. Once I get past the DateObject problem in MapThread[Select...] I may be over the hump.

$\endgroup$

1 Answer 1

2
$\begingroup$

Import the data as CSV directly from the website, use Rest to drop the first row of the results (i.e. the table headers), and convert the result to a TimeSeries object:

ts = TimeSeries@Rest@Import["https://fred.stlouisfed.org/graph/fredgraph.csv?bgcolor=%23e1e9f0&chart_type=line&drp=0&fo=open%20sans&graph_bgcolor=%23ffffff&height=450&mode=fred&recession_bars=on&txtcolor=%23444444&ts=12&tts=12&width=968&nt=0&thu=0&trc=0&show_legend=yes&show_axis_titles=yes&show_tooltip=yes&id=MORTGAGE30US&scale=left&cosd=1971-04-02&coed=2022-06-09&line_color=%234572a7&link_values=false&line_style=solid&mark_type=none&mw=3&lw=2&ost=-99999&oet=99999&mma=0&fml=a&fq=Weekly%2C%20Ending%20Thursday&fam=avg&fgst=lin&fgsnd=2020-02-01&line_index=1&transformation=lin&vintage_date=2022-06-11&revision_date=2022-06-11&nd=1971-04-02","CSV"]

Now use TimeSeriesWindow in a Table to extract subsections of the data, each one calendar year long. To do so, set the window granularity to one year (e.g. using DateObject[{2021}] would extract events from the time series that happened in 2021). The table returns a list of value pairs containing the year (as a DateObject) and the average for that year. Mean will automatically adjust to the number of samples in each subset, whether there are 52 or 53.

yearlyAverages = 
  Table[
    {DateObject[{year}], Mean@ TimeSeriesWindow[ts, DateObject[{year}]]}, 
    {year, 1990, 2021}
  ]

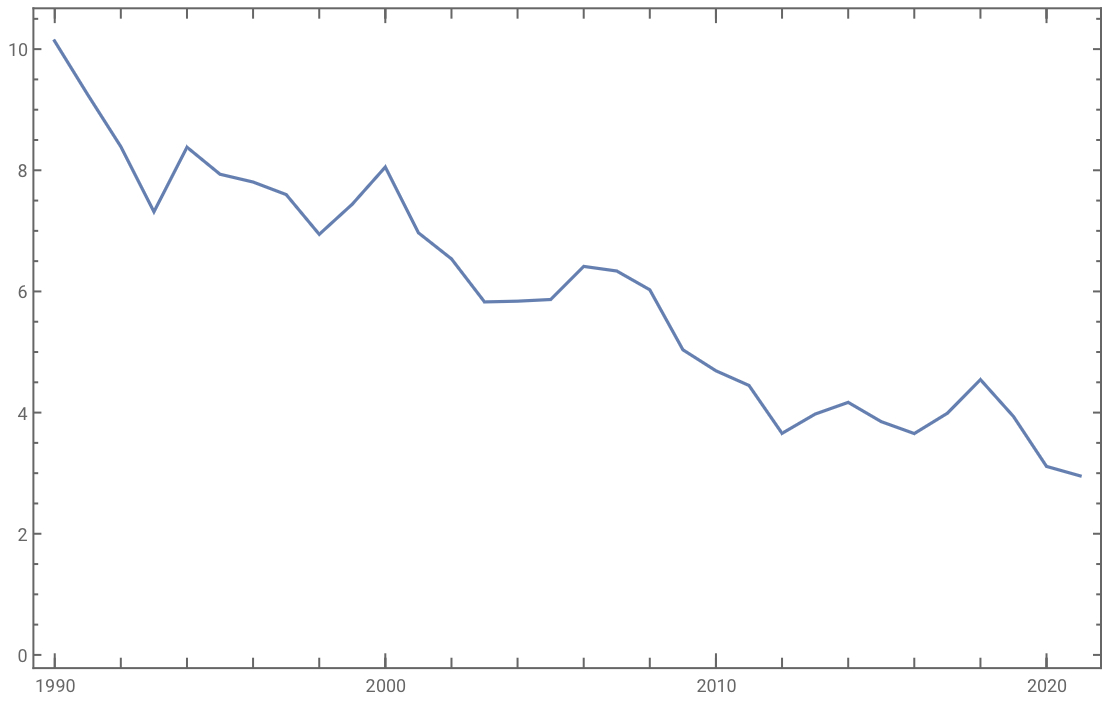
Finally, use DateListPlot to plot the results:

DateListPlot[yearlyAverages]

date scatterplot of yearly averages

$\endgroup$

Your Answer

By clicking “Post Your Answer”, you agree to our terms of service and acknowledge you have read our privacy policy.

Not the answer you're looking for? Browse other questions tagged or ask your own question.