14
$\begingroup$

Let's say I have the following plot Graphics[{Opacity[0.2], Rectangle[{0, 0}, {4, 4}]}]

And I want to label all vertices on the graph to give their coordinates, in this case, Point(0,0) as "P1", Point(0,4) as "P2"...

In general, I want to write a function: plotPolygonWithLabel[polygon_, label_]:=...

where label_ is the array like {"P1", "P2", } here

$\endgroup$
1
  • $\begingroup$ Qiang, you forgot about these old posts? $\endgroup$
    – kglr
    Commented Jul 22, 2018 at 7:33

7 Answers 7

10
$\begingroup$

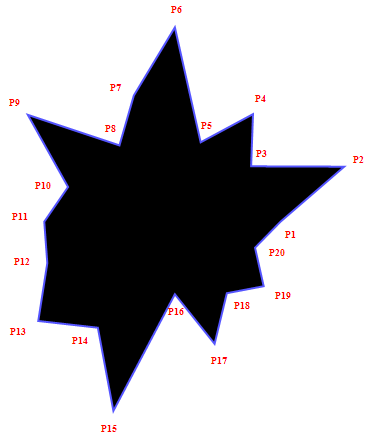
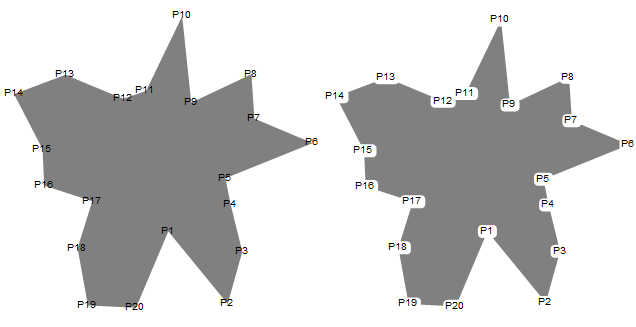
A slightly generalized version of Kuba's answer, by placing labels along the angular bisectors, which I think can handle most simply irregular polygons:

Clear[offsetFunc]
offsetFunc[pts : {Repeated[_List, {3}]}] :=
 Normalize[Most[Cross[{0, 0, 1},
                      Append[Total[Normalize /@ Differences[pts]], 0]
                     ]]]

Clear[labeledPolygon]
labeledPolygon[points_, labels_, offset_: 1] :=
 {
  Polygon@points,
  Text[Style[#1, Red, Bold],
       #2[[2]],
       offset offsetFunc[#2]] & @@@
   ({labels, Partition[points, 3, 1, {2, 2}]}\[Transpose])
  }

Example:

points = Table[RandomReal[{1, 3}] {Cos[t], Sin[t]}, {t, 0, 2 π, π/10}] // Most;

labels = Table["P" <> ToString[t], {t, Length@points}];

Graphics[{EdgeForm[{Lighter@Blue, Thick}], labeledPolygon[points, labels, 2]}]

example

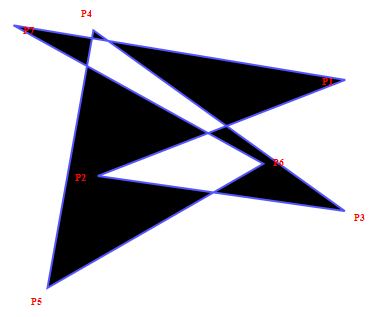
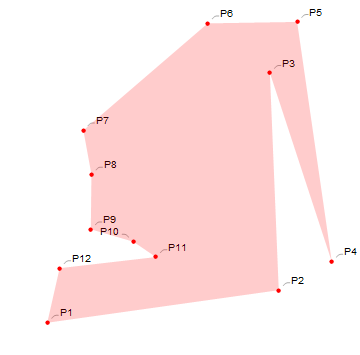
It may not perform well on non-simple polygon:

counter example

$\endgroup$
9
$\begingroup$

There are many methodst to achieve that, You can start with this:

points = Table[2 {Cos@t, Sin@t}, {t, 0, 2 Pi - .2 Pi, .2 Pi}]
labels = Table["P" <> ToString[t], {t, Length@points}]

 f[points_, labels_] :=With[{O = Mean@points}, 
  Graphics[{Polygon@points, 
    Text[#1, #2] & @@@ ({labels, ((.2 + Norm[# - O]) ( 
          Normalize[# - O]) + O) & /@ points}\[Transpose])}]]

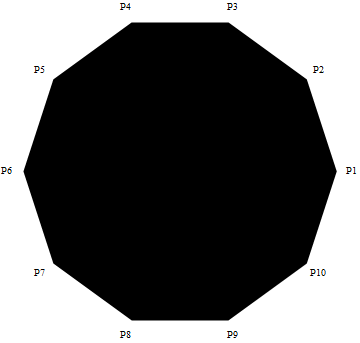
f[points,labels]

enter image description here

$\endgroup$
4
$\begingroup$

A different approach, but needs tweaking for graphical perfection:

plotPolygonWithLabel[polygon_, label_, fontSize_] := 
 {Polygon[polygon],
  MapThread[
   {EdgeForm[Thin],
     FaceForm[White],
     Disk[#1, (fontSize + 12)/72],
     Text[Style[#2, Black, fontSize, 
       FontFamily -> "Helvetica Bold", 
       Background -> White], #1]} & , 
   {polygon, label}]}

(* borrowing from Silvia ... *)
points = Table[
   RandomReal[{-3, 3}] {2 Cos[t], 2 Sin[t]}, {t, 0, 2 \[Pi], Pi/5}];

labels = Table["P" <> ToString[t], {t, Length@points}];

Graphics[{plotPolygonWithLabel[points, labels, 14]}]

alternative label style

$\endgroup$
3
$\begingroup$

PathGraph

You can use PathGraph or Graph with all the convenient options to style the labels, and add the polygon using Prolog:

ClearAll[labeledPolygonF]
labeledPolygonF[dir_: Opacity[.5, Blue], o1 : OptionsPattern[]][pts_, 
  lbls_, o2 : OptionsPattern[]] := 
 PathGraph[lbls, VertexCoordinates -> pts, o2, 
  VertexLabels -> Placed["Name", Center], VertexSize -> Large, 
  EdgeStyle -> Opacity[0], GraphStyle -> "DiagramGold", 
  Prolog -> Graphics[{dir, Polygon@pts}, o1][[1]]]

Alternatively, you can use Graph with the first argument UndirectedEdge @@@ Partition[lbls, 2, 1] to get the same results.

Silvia's example:

SeedRandom[1]
points = Table[RandomReal[{1, 3}] {Cos[t], Sin[t]}, {t, 0, 2 π, π/10}] // Most;
labels = Table["P" <> ToString[t], {t, Length@points}];

labeledPolygonF[][points, labels]
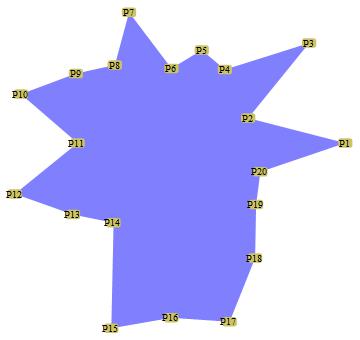
enter image description here

labeledPolygonF[Opacity[.5, Green]][points, labels, 
 VertexShapeFunction -> "Capsule", VertexSize -> 1, 
 VertexStyle -> Red, VertexLabelStyle -> Directive[14, White]]
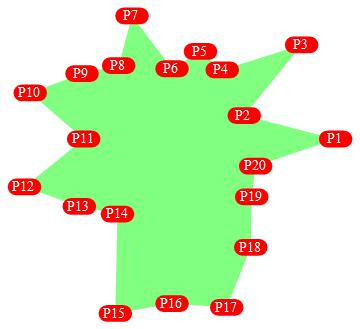
enter image description here

Since labeledPolygonF gives a Graph you have access to a number of conveninent functions in a right-click menu. For example, in the first example above, you can change the GraphStyle by selecting GraphStyle >> SmallNetwork on the right-click menu to get
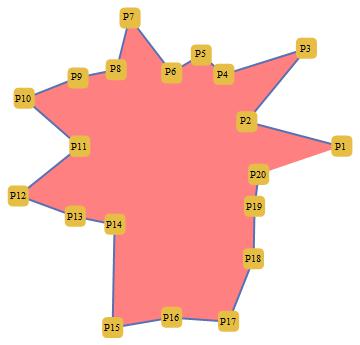
enter image description here

If you need a Graphics object you can use

Show @ labeledPolygonF[...]

cormullion's example:

SeedRandom[12345]
points2 = Table[RandomReal[{-3, 3}] {2 Cos[t], 2 Sin[t]}, {t, 0, 2 π, π/5}];
labels2 = Table["P" <> ToString[t], {t, Length@points2}];

labeledPolygonF[Opacity[.8, Yellow], ImageSize -> 500][points2, labels2, 
    VertexSize -> .7, VertexStyle -> Blue, 
    VertexShapeFunction -> "Hexagon",  VertexLabelStyle -> Directive[White, Medium]]
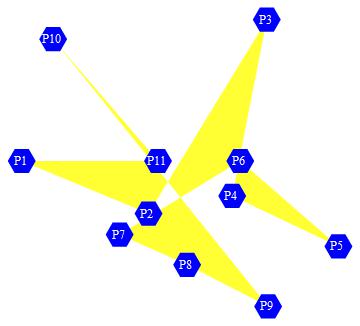
enter image description here

$\endgroup$
3
$\begingroup$
points = RandomReal[{1, 3}, 20] CirclePoints[20.];

labels = Table["P" <> ToString[t], {t, Length@points}];

Graphics[{{Opacity[0.5], Polygon@points}, MapThread[Text, {labels, points}]}]

Show[Graphics[{Opacity[0.5], Polygon@points}], 
  ListPlot[points -> labels, LabelingFunction -> Center]]

enter image description here

$\endgroup$
1
$\begingroup$

Using ListPlot and MeshPrimitives:

SeedRandom[1];
poly = RandomPolygon[{"Simple", RandomInteger[{11, 20}]}];
labels = Table[
   "P" <> ToString[t], {t, Length@MeshPrimitives[poly, 0]}];

ListPlot[{Sequence @@@ MeshPrimitives[poly, 0] -> labels}
 , Epilog -> {Opacity[0.2, Red], poly}
 , AspectRatio -> Automatic
 , PlotStyle -> Red
 , Axes -> False
 ]

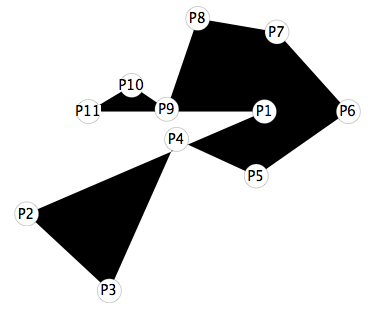
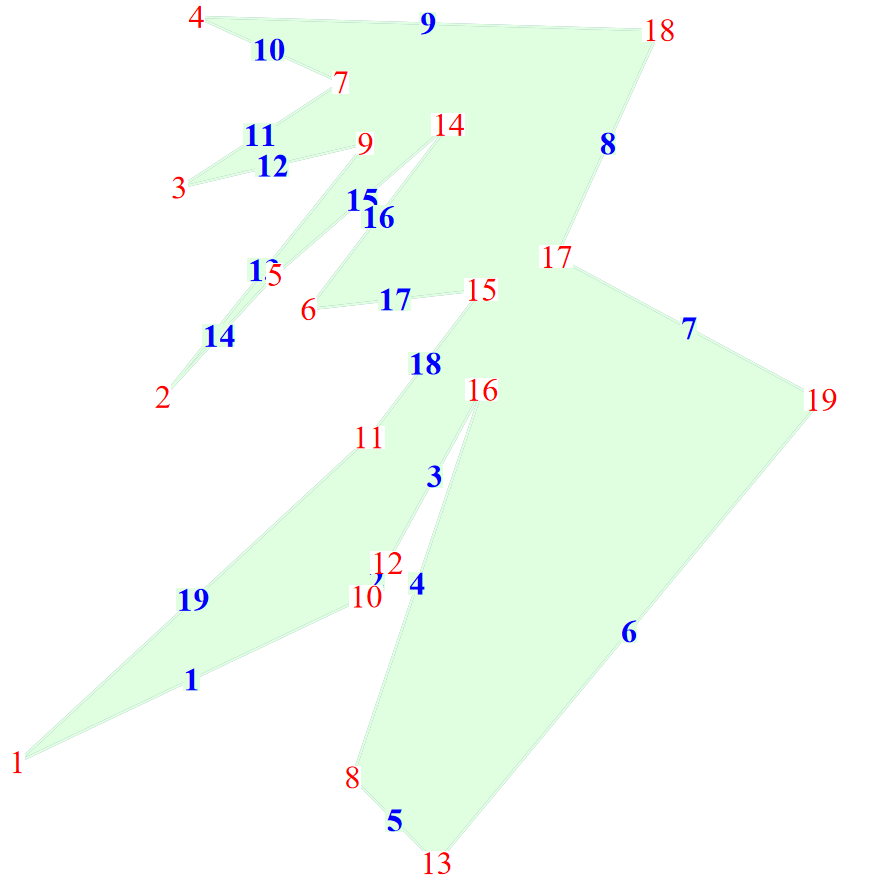
labeled polygon

$\endgroup$
1
$\begingroup$
  • HilightMesh
poly = RandomPolygon[19];
HighlightMesh[poly, {Labeled[0, "Index", "Centroid", 
   Style[#, Red, 14, FontFamily -> "Times", Background -> White] &], 
  Labeled[1, "Index", "Centroid", 
   Style[#, Blue, Bold, 14, FontFamily -> "Times", 
     Background -> LightGreen] &], Style[2, LightGreen]}]

enter image description here

$\endgroup$

Your Answer

By clicking “Post Your Answer”, you agree to our terms of service and acknowledge you have read our privacy policy.

Not the answer you're looking for? Browse other questions tagged or ask your own question.