The question is inspired by that article ( see Wiki as a first reading on the topic). This is an actual topic of modern mathematical physics. Here is my (partly successful) attempt to implement such graphs in Mathematica.
Let a graph be located in Disk[{0,0},r] (of hyperbolic radius R = ArcCosh[1 + 2/(1 - r^2)]).
First, we create a random set of its vertices by
r = 99/100; R = ArcCosh[1 + 2/(1 - r^2)]; SeedRandom[1234];
vertices = Table[{RandomVariate[UniformDistribution[{0, 2*Pi}], 1][[1]],
RandomVariate[ProbabilityDistribution[Sinh[t]/(-1 + Cosh[R]), {t, 0, R}], 1][[1]]}, {j, 1, 30}];
, following formula (1) from the linked article with \[Alpha]=1.
Second, we create a random set of its edges by
edges = Apply[UndirectedEdge, #] & /@ RandomSample[Subsets[vertices, {2}], 80];
We choose 80 random two-elemented subsets of vertices by RandomSample[Subsets[vertices, {2}], 80]
and then transform the ones to edges by Apply[UndirectedEdge, #] & /@.
Now
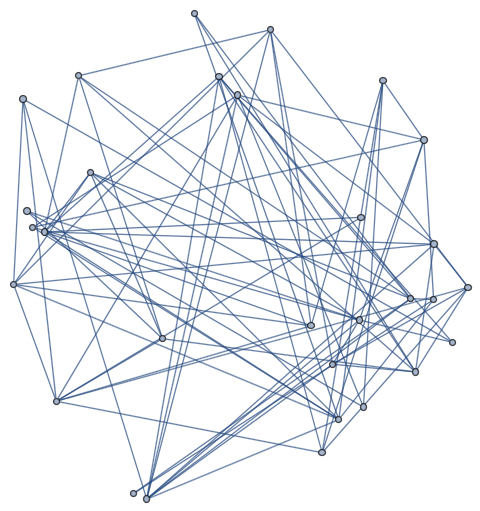
Graph[vertices, edges, VertexCoordinates ->
Table[vertices[[j]] -> {vertices[[j]][[2]]*Cos[vertices[[j]][[1]]],
vertices[[j]][[2]]*Sin[vertices[[j]][[1]]]}, {j, 1,  Dimensions[vertices][[1]]}]]
 The coordinates of
 vertices are polar $(\phi,r)$ so we have to change these to cartesian coordinates.
The above is a somewhat unfinished work.
(i) Physicists often use the following construction: any two vertices $u$ and $v$ are connected by an edge if their hyperbolic distance
$\textrm{dist}H(u, v)$ is below a certain number $\rho$. Neither BernoulliGraphDistribution nor BarabasiAlbertGraphDistribution realize it. How to do it?
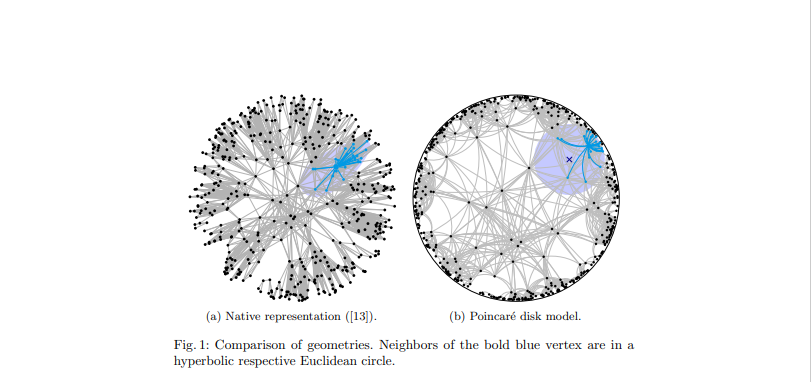
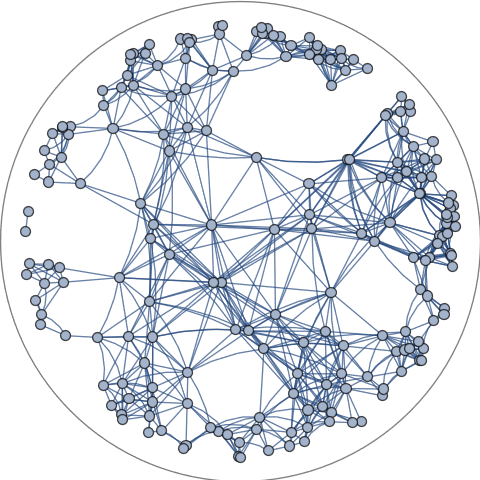
(ii) In the above edges are drawn as lines. How to draw edges as hyperbolic lines ( compare (a) and (b) in Fig. 1) ?


