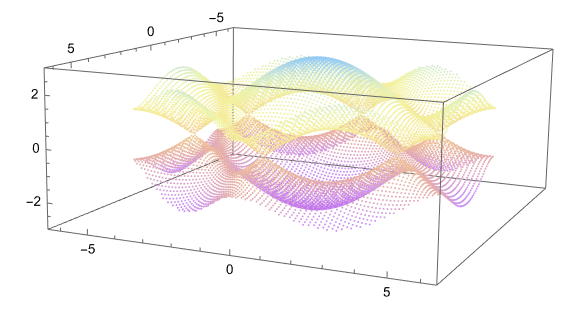
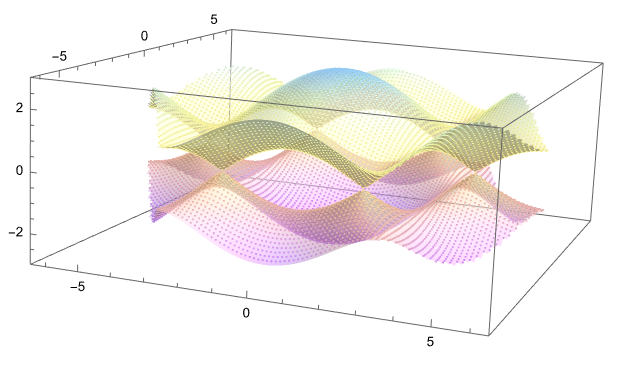
The answer to the first part of the question is the option RegionBoundaryStyle -> None. The answer to the second part of the question is: ListSurfacePlot3D does not seem to able to create a meaningful surface even when using data on such a block-structured grid. A possible solution is to create the surface manually using polygons. I added a working minimal example based on the code provided in the question. I simplified the rather convoluted RegionFunction by using hexRegion=Region[RegularPolygon[2 \[Pi], 6]] to parametrize the hexagon. Additionally I specified a color function to ensure unified coloring across the different plots.
a1={0,1/Sqrt[3]};
a2={-1/2,-1/(2*Sqrt[3])};
a3={1/2,-1/(2*Sqrt[3])};
kvec={kx,ky};

nvalue=1;
{{
  -2*t*(Cos[kvec.a1-phi]+Cos[kvec.a2-phi]+Cos[kvec.a3-phi]),
  Exp[I*kvec.a1]+Exp[I*kvec.a2]+Exp[I*kvec.a3]
},{
  Exp[-I*kvec.a1]+Exp[-I*kvec.a2]+Exp[-I*kvec.a3],
  -2*t*(Cos[kvec.a1+phi]+Cos[kvec.a2+phi]+Cos[kvec.a3+phi])
}};
graphenehamiltonian[kx_,ky_,t_,phi_]=%;

kxrange=N[Range[-2*Pi+2*Pi/100,2*Pi-2*Pi/100,4*Pi/100]];
kyrange=N[Range[-2*Pi+2*Pi/100,2*Pi-2*Pi/100,4*Pi/100]];

tval=0;
phival=0;
eigsys=Table[N[Eigensystem[graphenehamiltonian[kxrange[[i]],kyrange[[j]],tval,phival]]],{i,100},{j,100}];
eigvals=eigsys[[All,All,1]];
eigvecs=eigsys[[All,All,2]];

hexRegion=Region[RegularPolygon[2\[Pi],6]];
data=Table[{kxrange[[i]],kyrange[[k]],eigvals[[i]][[k]][[j]]},{i,100},{k,100},{j,2*nvalue}];
cfun=ColorData["Pastel"][(#3+2.5)/6]&;
First the ListPointPlot3D plots:
band1=ListPointPlot3D[data[[All,All,1,All]],RegionFunction->Function[{x,y,z},{x,y}\[Element]hexRegion],ColorFunction->cfun,RegionBoundaryStyle->None,ColorFunctionScaling->False];
band2=ListPointPlot3D[data[[All,All,2,All]],RegionFunction->Function[{x,y,z},{x,y}\[Element]hexRegion],ColorFunction->cfun,RegionBoundaryStyle->None,ColorFunctionScaling->False];

plot1=Show[band1,band2]

and here the manually generated surface plot (with 50% opacity overlaying the previous plot):
band1polygons=Table[With[{
  a={kxrange[[i]],kyrange[[k]],eigvals[[i]][[k]][[1]]},
  b={kxrange[[i+1]],kyrange[[k]],eigvals[[i+1]][[k]][[1]]},
  c={kxrange[[i+1]],kyrange[[k+1]],eigvals[[i+1]][[k+1]][[1]]},
  d={kxrange[[i]],kyrange[[k+1]],eigvals[[i]][[k+1]][[1]]}},
If[Mean[{a,b,c,d}[[All,{1,2}]]]\[Element]hexRegion,{EdgeForm[],cfun[0,0,Mean[{a,b,c,d}[[All,3]]]],Polygon[{a,b,c,d}]},Nothing]],{i,99},{k,99}];

band2polygons=Table[With[{
  a={kxrange[[i]],kyrange[[k]],eigvals[[i]][[k]][[2]]},
  b={kxrange[[i+1]],kyrange[[k]],eigvals[[i+1]][[k]][[2]]},
  c={kxrange[[i+1]],kyrange[[k+1]],eigvals[[i+1]][[k+1]][[2]]},
  d={kxrange[[i]],kyrange[[k+1]],eigvals[[i]][[k+1]][[2]]}},
If[Mean[{a,b,c,d}[[All,{1,2}]]]\[Element]hexRegion,{EdgeForm[],cfun[0,0,Mean[{a,b,c,d}[[All,3]]]],Polygon[{a,b,c,d}]},Nothing]],{i,99},{k,99}];

Show[{plot1,Graphics3D[{Opacity[.5],band1polygons}],Graphics3D[{Opacity[.5],band2polygons}]}]

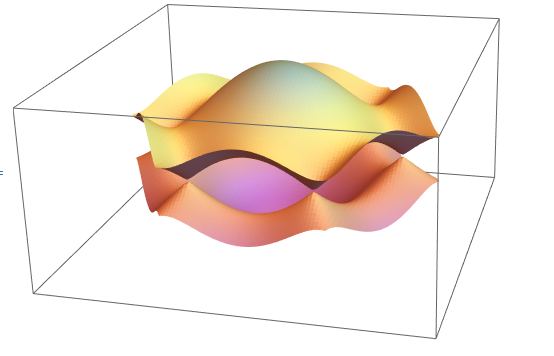
The edges of the surface a a bit rough since I just excluded polygons outside the hexagon without modifying or detecting edges. Another (probably cleaner solution) would be to render all Polygons and use ClipPlanes for Graphics3D to generate the hexagonal area:
Table[Sqrt[3]\[Pi]{Sin[phi],Cos[phi],0},{phi,0+Pi/6,2Pi+Pi/6,Pi/3}];
hexPlanes=Table[InfinitePlane[{%[[i]],%[[i+1]],%[[i]]+{0,0,1}}],{i,1,6}];

band1polygons=Table[With[{
  a={kxrange[[i]],kyrange[[k]],eigvals[[i]][[k]][[1]]},
  b={kxrange[[i+1]],kyrange[[k]],eigvals[[i+1]][[k]][[1]]},
  c={kxrange[[i+1]],kyrange[[k+1]],eigvals[[i+1]][[k+1]][[1]]},
  d={kxrange[[i]],kyrange[[k+1]],eigvals[[i]][[k+1]][[1]]}},
{EdgeForm[],cfun[0,0,Mean[{a,b,c,d}[[All,3]]]],Polygon[{a,b,c,d}]}],{i,99},{k,99}];

band2polygons=Table[With[{
  a={kxrange[[i]],kyrange[[k]],eigvals[[i]][[k]][[2]]},
  b={kxrange[[i+1]],kyrange[[k]],eigvals[[i+1]][[k]][[2]]},
  c={kxrange[[i+1]],kyrange[[k+1]],eigvals[[i+1]][[k+1]][[2]]},
  d={kxrange[[i]],kyrange[[k+1]],eigvals[[i]][[k+1]][[2]]}},
{EdgeForm[],cfun[0,0,Mean[{a,b,c,d}[[All,3]]]],Polygon[{a,b,c,d}]}],{i,99},{k,99}];

Show[{Graphics3D[band1polygons~Join~band2polygons, ClipPlanes->hexPlanes]}]


tval,phival? Please copy your code from this page to a new notebook and evaluate it with a fresh kernel in order to determine what doesn't evaluate. $\endgroup$