4
$\begingroup$

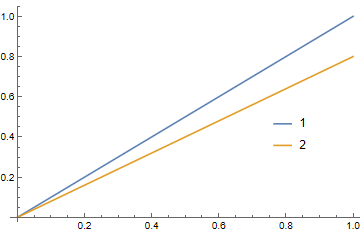
Consider the following plot

plot = ListLinePlot[{{{0, 0}, {1, 1}}, {{0, 0}, {1, .8}}}, PlotLegends -> Placed[{"1", "2"}, {.8, .4}]]

enter image description here

When I try to apply Image[plot] I get the following error

enter image description here

If I remove the Placed option, however, this is fixed. Any idea how to fix this? I'm using Mathematica version 13.0.0.

$\endgroup$
2
  • 2
    $\begingroup$ Image@Rasterize@plot $\endgroup$
    – Bob Hanlon
    Commented Jan 11, 2022 at 18:47
  • 1
    $\begingroup$ or Rasterize[plot, "Image"] $\endgroup$
    – chuy
    Commented Jan 11, 2022 at 19:45

4 Answers 4

4
$\begingroup$
p2 = ListLinePlot[{{{0, 0}, {1, 1}}, {{0, 0}, {1, .8}}}
  , Epilog -> 
   Inset[LineLegend[{ColorData[97][1], ColorData[97][2]}, {"1", 
      "2"}], {.8, .4}]
  ]

Head[%]

Image[p2]

EDIT-1 From the docs: Inset[obj,pos] is one of the available syntax. In response to the OP's comment, a manipulate is being added to show usage. As soon as Placed is used, the Head changes to Legended.

Manipulate[
 p3 = ListLinePlot[{
    {{0, 0}, {1, 1}}
    , {{0, 0}, {1, .8}}
    }
   , ImagePadding -> {{10, 10}, {10, 10}}
   , Epilog -> Inset[LineLegend[
      {ColorData[97][1]
       , ColorData[97][2]}
      , {"1", "2"}], {i, j}
     ]
   ],
 {{i, 0.5, "x", Appearance -> Labeled}, 0.1, 1.0}
 , {{j, 0.5, "y", Appearance -> Labeled}, 0.1, 1.0}
 ]
$\endgroup$
1
  • $\begingroup$ Epilog and Inset is a nice solution, but I wonder what the placement here means, what exactly are those units? With Placed, it was easy to see because the position corresponded to cartesian coordinates, here I'm not sure. Any idea? $\endgroup$
    – sam wolfe
    Commented Jan 11, 2022 at 19:32
3
$\begingroup$
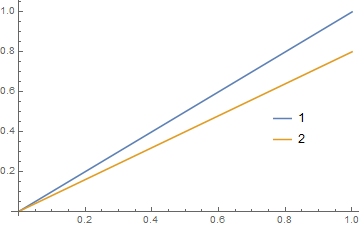
Rasterize[plot]

enter image description here

Head @ %
Image
$\endgroup$
2
  • $\begingroup$ Is it possible to define the resolution of such image with Rasterize? $\endgroup$
    – sam wolfe
    Commented Jan 12, 2022 at 12:28
  • 1
    $\begingroup$ @samwolfe, you can play with the options ImageResolution and RasterSize in Rasterize. $\endgroup$
    – kglr
    Commented Jan 12, 2022 at 20:21
2
$\begingroup$

Note that "plot" has a head of "Legended".

I do not know a straight way to change this into an image: However, a work around could be to save the plot as a PNG file and then importing as an image. However, the quality could be better.

Export["d:/tmp/test.png", plot]
img = Import["d:/tmp/test.png"]

enter image description here

$\endgroup$
2
  • $\begingroup$ Do you agree that I should add a bug tag? $\endgroup$
    – yode
    Commented Jan 11, 2022 at 19:03
  • $\begingroup$ @yode - I do not agree with a bug tag. The documentation for Image indicates that its argument should either be an array of data or a graphics. Since this plot does not have a Head of either Graphics or Graphics3D; it is not a valid input as indicated in the resulting error message. $\endgroup$
    – Bob Hanlon
    Commented Jan 11, 2022 at 19:36
1
$\begingroup$

Simple solution:

ImportString[ExportString[plot, "PNG"], "PNG"]

Lossless solution:

Export["test.svg", plot]
img = ResourceFunction["SVGImport"]["test.svg"]
$\endgroup$

Your Answer

By clicking “Post Your Answer”, you agree to our terms of service and acknowledge you have read our privacy policy.

Not the answer you're looking for? Browse other questions tagged or ask your own question.