13
$\begingroup$

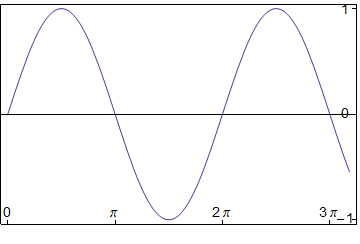
Is there a way to force Plot and related functions to place the tick labels inside, rather than outside a frame? For example, consider,

Plot[Sin[x], {x, 0, 10}, Frame -> True]

When this line is executed, the tick labels are outside the bottom and left edges of the frame:
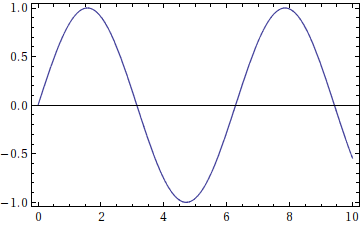
enter image description here

Is there an easy way to move them to the inside?

(Why place tick labels inside the frame, you ask? I would like to export plots to PDF in a specified absolute size, so that one major tick on the plot is exactly 1 cm on the printout. If the labels were not placed on the outside, padding the image, this could be easily done using ImageSize, as described here.)

$\endgroup$
4
  • $\begingroup$ You can fix the size of the graphic and the plot area simultaneously using ImagePadding as well as ImageSize. But some organizations use this style for their graphs so it would be useful to replicate. $\endgroup$
    – Verbeia
    Commented Mar 5, 2012 at 19:33
  • $\begingroup$ Ted, do you mean something like the last graph in this question? $\endgroup$
    – Verbeia
    Commented Mar 5, 2012 at 20:11
  • $\begingroup$ Nevertheless it would be nice to know if tick labels could be placed inside the plot without too much hacking. $\endgroup$ Commented Mar 5, 2012 at 22:32
  • $\begingroup$ @Verbeia, yes, the arrangement of the y-frame labels in last graph in the question you linked to is what I had in mind. $\endgroup$
    – Ted Pudlik
    Commented Mar 6, 2012 at 1:18

2 Answers 2

10
$\begingroup$

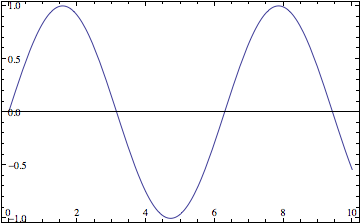
You could do something like this:

Plot[Sin[x], {x, 0, 10}, Frame -> True,
 Epilog -> {Table[Text[i, {i, -1}, {0, -1}], {i, Range[0, 10, 2]}],
  Table[Text[NumberForm[i, {2, 1}], {0, i}, {-1, 0}], {i, Range[-1, 1, .5]}]},
 FrameTicksStyle -> (FontOpacity -> 0),
 ImagePadding -> {{1, 1}, {1, 1}}]

Mathematica graphics

$\endgroup$
1
  • $\begingroup$ Much more concise than I had thought possible: thank you! $\endgroup$
    – Ted Pudlik
    Commented Mar 6, 2012 at 1:20
4
$\begingroup$

I don't know of an easy way, but with the help of Epilog, Inset and Scaled (the latter using a combo of absolute coordinates and scaled offsets) it's quite doable:

Plot[Sin[x], {x, 0, 10}, Frame -> True, 
 FrameTicks -> {{None, {{-1, ""}, {0, ""}, {1, ""}}}, {{{0, ""}, {Pi, 
      ""}, {2 Pi, ""}, {3 Pi, ""}}, None}}, 
  Epilog ->
  {
   Inset[0, Scaled[{0, -0.45}, {0, 0}]],
   Inset[\[Pi], Scaled[{0, -0.45}, {\[Pi], 0}]],
   Inset[2 \[Pi], Scaled[{0, -0.45}, {2 \[Pi], 0}]],
   Inset[3 \[Pi], Scaled[{0, -0.45}, {3 \[Pi], 0}]],
   Inset[-1, Scaled[{0.95, 0}, {0, -0.99}]],
   Inset[0, Scaled[{0.95, 0}, {0, 0}]],
   Inset[1, Scaled[{0.95, 0}, {0, 0.99}]]
   },
 BaseStyle -> {FontFamily -> "Arial", FontSize -> 14}
]

Mathematica graphics

$\endgroup$

Your Answer

By clicking “Post Your Answer”, you agree to our terms of service and acknowledge you have read our privacy policy.

Not the answer you're looking for? Browse other questions tagged or ask your own question.