I am new to Mathematica, and am unsure on how to start this.
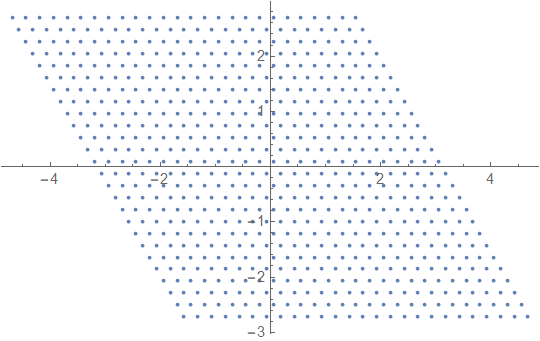
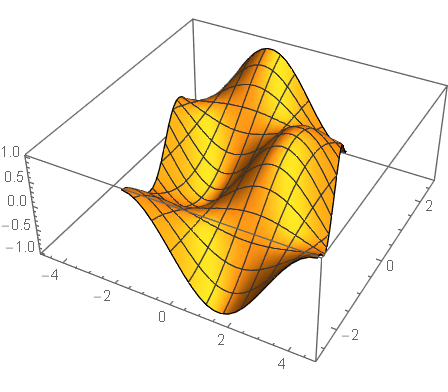
I am working with a triangular lattice $\mathcal{T}$ with basis vectors $(1,0)$ and$\left(-\frac{1}{2},\frac{\sqrt{3}}{2}\right)$, and have a function $f:\mathcal{T}\to\mathbb{R}$ that is defined on this triangular lattice. I want to be able to plot this function on this triangular lattice, any help would be appreciated.
I assume first I have to create the triangular lattice $\mathcal{T}$ as say $\mathtt{T=...}$ and then perform the Plot3D command as follows: $\texttt{Plot3D[f[x,y],{x,y}$\in$T]}$.
The question is then really, how would I generate this point set $\mathtt{T}$.


