6
$\begingroup$

Consider the following: The Jacobian matrix J given below correctly generates the eigenvalues for the (x,y) fixed point shown below. When looking at the stability of the fixed point the absolute values of the eigenvalues of J are needed. In this case, the eigenvalues are complex and hence the absolute value is the complex conjugate of the two eigenvalues. All this too is correctly computed. Since the complex conjugate of these two eigenvalues is less than one, it follows the fixed point is stable.

How would a Phase Portrait or the Mathematica function Stream be used to show that the ABSOLUTE VALUE of the eigenvalues of J show stability since their complex conjugate is such that both eigenvalues are less than unity?

Clear["Global`*"]
(*Jacobian Matrix J, Evaluated at Fixed Point x = (1-b)/p, y = c(p+b-1)/(p*(1-b+c))*)
f1={(1-p*y)*x+c*(1-x-y),(p*x+b)*y};
f2={x,y};
J=Grad[f1,f2]//MatrixForm
(*Jacobian Evaluated at the Fixed Point x = (1-b)/p, y = c(p+b-1)/(p*(1-b+c))*)
J=Grad[f1,f2]/.{x->(1-b)/p,y->c (p+b-1)/(p*(1-b+c))}//MatrixForm
J=Grad[f1,f2]/.{x->(1-b)/p,y->c (p+b-1)/(p*(1-b+c))};
Eigenvalues[J]//MatrixForm
Eigenvalues[J]/.{p->0.8,b->0.5,c->0.01}
Abs[%]
Eigenvectors[J]/.{p->0.8,b->0.5,c->0.01}

Here is the difference equation that produced the above fixed points.

Clear["Global`*"]
x0=0.90;y0=0.10;z0=0;p=0.8;b=0.5;c=0.01;
{tmin,tmax}={0,25};
N[TableForm[MapThread[Prepend,{RecurrenceTable[{x[t+1]==(1-p*y[t])*x[t]+c*(1-x[t]-y[t]),
y[t+1]==(p*x[t]+b)*y[t],z[t+1]==(1-c)*z[t]+(1-b)*y[t],x[0]==x0,y[0]==y0,z[0]==z0},{x,y,z},{t,tmin,tmax}],Range[tmin,tmax]}],TableHeadings->{None,{"t","x[t]","y[t]","z[t]"}}]]
$\endgroup$
8
  • $\begingroup$ Are you thinking of a differential equation or a difference equation? $\endgroup$
    – Chris K
    Commented Aug 15, 2021 at 20:57
  • $\begingroup$ it's actually a difference equation $\endgroup$
    – user42700
    Commented Aug 15, 2021 at 21:24
  • $\begingroup$ I just added it the code (below the first part of code). I'm interested in the phase portrait of x and y; don't need z. $\endgroup$
    – user42700
    Commented Aug 15, 2021 at 21:33
  • 1
    $\begingroup$ For difference equations, you can build phase space using a set of initial conditions (select initials and iterate). Since you know fixed points, just select initials near them. $\endgroup$
    – I.M.
    Commented Aug 18, 2021 at 4:09
  • 1
    $\begingroup$ @PRG Your system is 3D in (x,y,z) space and it depends on 6 parameters x0,y0,z0,p,b,c. Why do you use 2D subspace to compute Jacobian? $\endgroup$ Commented Aug 18, 2021 at 5:08

3 Answers 3

5
$\begingroup$

The Discrete System:

$$ \begin{align} x_{n+1}&=c \left(1-(x_n+y_n)\right)+x_n \left(1-p y_n\right)\\ y_{n+1}&=\left(p x_n+b\right)y_n \end{align} $$

The Discrete System code:

F[{x_, y_}, {b_, c_, p_}] := Evaluate[{(1 - p*y)*x + c*(1 - x - y), (p*x + b)*y}]
MatrixForm@(F[X, μ])
X = {x, y};
μ = {b, c, p};

The Jacobian Matrix:

J[{x_, y_}, {b_, c_, p_}] := Evaluate@D[F[X, μ], {X}]
MatrixForm@(J[X, μ])

The fixed points:

X1[{b_, c_, p_}] = Simplify@SolveValues[F[X, μ] - X == 0, X][[1]];
X2[{b_, c_, p_}] = Simplify@SolveValues[F[X, μ] - X == 0, X][[2]];
MatrixForm@X1[μ]
MatrixForm@X2[μ]

Linear approximations:

J1[{b_, c_, p_}] := Evaluate[FullSimplify@J[X1, μ]]
J2[{b_, c_, p_}] := Evaluate[FullSimplify@J[X2, μ]]
MatrixForm[J1[μ]]
J2[{b_, c_, p_}] := Evaluate[FullSimplify@J[X2, μ]]
MatrixForm[J1[μ]]

Conditions on the parameters to study the stability of the fixed points:

Local stability of the fixed point $X_{1}$:

Reduce[Tr[J1[μ]] - 1 < Det[J1[μ]] < 1 && Variables[J1[μ]] > 0](*locally stable*)
(*Conditions on system parameters*)
Reduce[1 < Det[J1[μ]] < Tr[J1[μ]] - 1 && Variables[J1[μ]] > 0](*locally unstable*)
(*False*)

Local stability of the fixed point $X_{2}$:

Reduce[Tr[J2[μ]] - 1 < Det[J2[μ]] < 1 && Variables[J2[μ]] > 0](*locally stable*)
(*Conditions on system parameters*)
Reduce[1 < Det[J2[μ]] < Tr[J2[μ]] - 1 && Variables[J2[μ]] > 0](*locally unstable*)
(*Conditions on system parameters*)

Stability test for $X_{1}$ with $b=1/2$, $c=1/100$ and $p=8/10$:

μ0 = {1/2, 1/100, 8/10};
Det[J1[μ0]]
Det[J1[μ0]] < 1
Tr[J2[μ0]] - 1 < Det[J2[μ0]] < 1 (*Stability*)
(*16781/17000*)
(*True*)
(*True*)

Stability test for $X_{2}$ with $b=1/2$, $c=1/100$ and $p=8/10$:

μ0 = {1/2, 1/100, 8/10};
Det[J2[μ0]]
Det[J2[μ0]] < 1
Tr[J2[μ0]] - 1 < Det[J2[μ0]] < 1 (*Stability*)
(*1287/1000*)
(*False*)
(*False*)

Time Series and Phase Portrait:

Using RecurrenceTable:

data = With[{b = 1/2, c = 1/100, p = 8/10, X0 = {1, 3/10}}, 
RecurrenceTable[{x[n + 1] == (1 - p*y[n])*x[n] + c*(1 - x[n] - y[n]), 
y[n + 1] == (p*x[n] + b)*y[n], {x[0], y[0]} == {X0[[1]], X0[[2]]}}, {x, y}, 
{n, 1, 1300}]];

Time Series:

ListPlot[data[[All, 1]], Frame -> True, FrameStyle -> Black, 
PlotStyle -> {Blue}, PlotRange -> {All, {0, 0.9}}, AspectRatio -> 1/GoldenRatio]
ListPlot[data[[All, 2]], Frame -> True, FrameStyle -> Black, 
PlotStyle -> {Red}, PlotRange -> {All, {0, 0.065}}, AspectRatio -> 1/GoldenRatio]

Time Series

Phase Portrait:

ListPlot[data, Frame -> True, FrameStyle -> Black, 
PlotRange -> {All, {-0.005, 0.11}}, PlotStyle -> Black, AspectRatio -> 1]
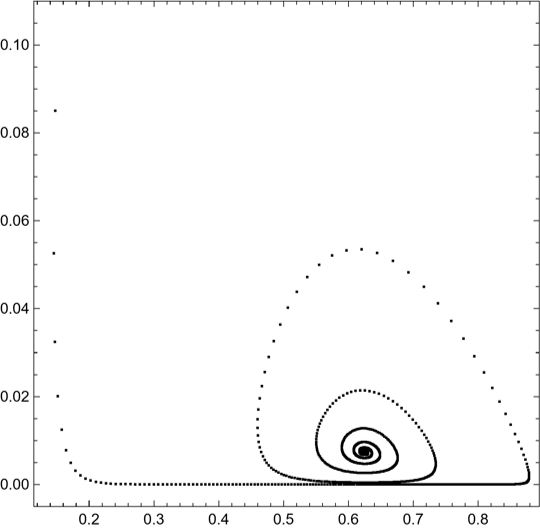
Phase Portrait

An additional code:

PhasePortrait[data_, linap_, fp_, range_, style_] := Module[{stcond, plot}, 
stcond[linap2_, fp2_] = Piecewise[{{Graphics[List[PointSize[0.012], Lighter[Blue], 
Point[fp]]], Tr[linap] - 1 < Det[linap] < 1}, {Graphics[
List[{PointSize[0.012], Black, Point[fp]}, {PointSize[0.006], 
     White, Point[fp]}]], 1 < Det[linap] < Tr[linap] - 1}}]; 
plot = ListPlot[data, PlotRange -> range, PlotStyle -> style, 
Frame -> True, FrameStyle -> Black, AspectRatio -> 1, 
ImageSize -> Medium];
Return[Show[plot, stcond[linap, fp]]]]
(*We can improve this code, PRG!*)

Note: If $\text{det}(J(X_{0}))=1$, the fixed point $X_{0}$ can be stable or unstable and, along with other conditions, it can be a Neimark-Sacker bifurcation.

Test:

PhasePortrait[data, J1[μ0], X1[μ0], {All, {-0.005, 0.11}}, Black]

I hope you enjoy it!

$\endgroup$
2
  • 1
    $\begingroup$ E. Chan-López: Amazingly creative!! ... truly clever ... many thank you's ... as a teacher sharing knowledge like this is admirable and this contributes so well to student learning ... v/r ... @prg $\endgroup$
    – user42700
    Commented Sep 6, 2021 at 17:50
  • $\begingroup$ @prg I appreciate your assessment on this small contribution. I consider sharing to be a feedback process. $\endgroup$ Commented Sep 8, 2021 at 3:11
10
+200
$\begingroup$

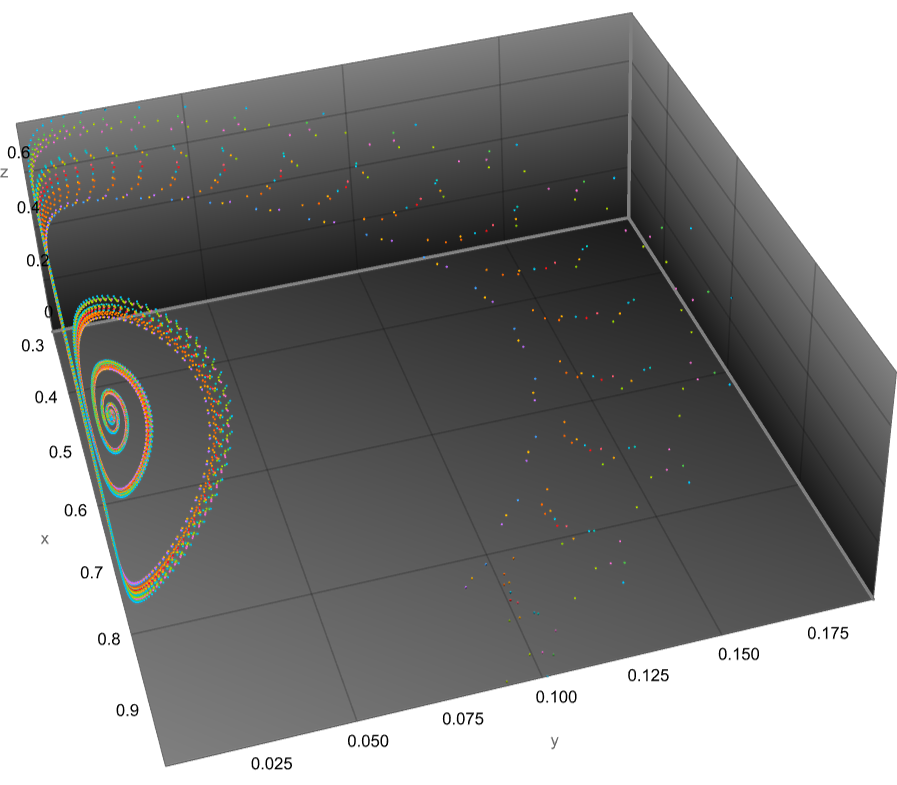
First, we can plot phase portrait for 3D system as follows (see comment @I.M.)

Clear["Global`*"]
x0 = 0.90; y0 = 0.10; z0 = 0; p = 0.8; b = 0.5; c = 0.01; Do[
 lst[i] = RecurrenceTable[{x[t + 1] == (1 - p*y[t])*x[t] + 
       c*(1 - x[t] - y[t]), y[t + 1] == (p*x[t] + b)*y[t], 
     z[t + 1] == (1 - c)*z[t] + (1 - b)*y[t], 
     x[0] == x0 (1 + .1 RandomReal[{-1, 1}]), 
     y[0] == y0 (1 + .1 RandomReal[{-1, 1}]), 
     z[0] == z0 (1 + .1 RandomReal[{-1, 1}])}, {x, y, z}, {t, 0, 
     1000}];, {i, 20}]

ListPointPlot3D[Table[lst[i], {i, 20}], PlotRange -> All, 
 PlotTheme -> "Marketing", AxesLabel -> {"x", "y", "z"}]

Figure 1

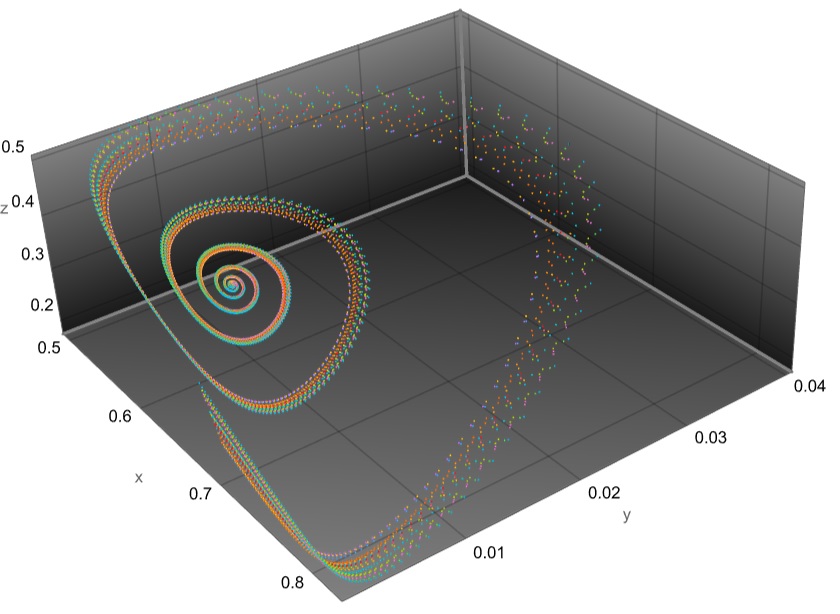
Note, we also can drop first 100-200 points in every list[i] to make it more clear

ListPointPlot3D[Table[Drop[lst[i], 100], {i, 20}], PlotRange -> All, 
 PlotTheme -> "Marketing", AxesLabel -> {"x", "y", "z"}]

Figure 2

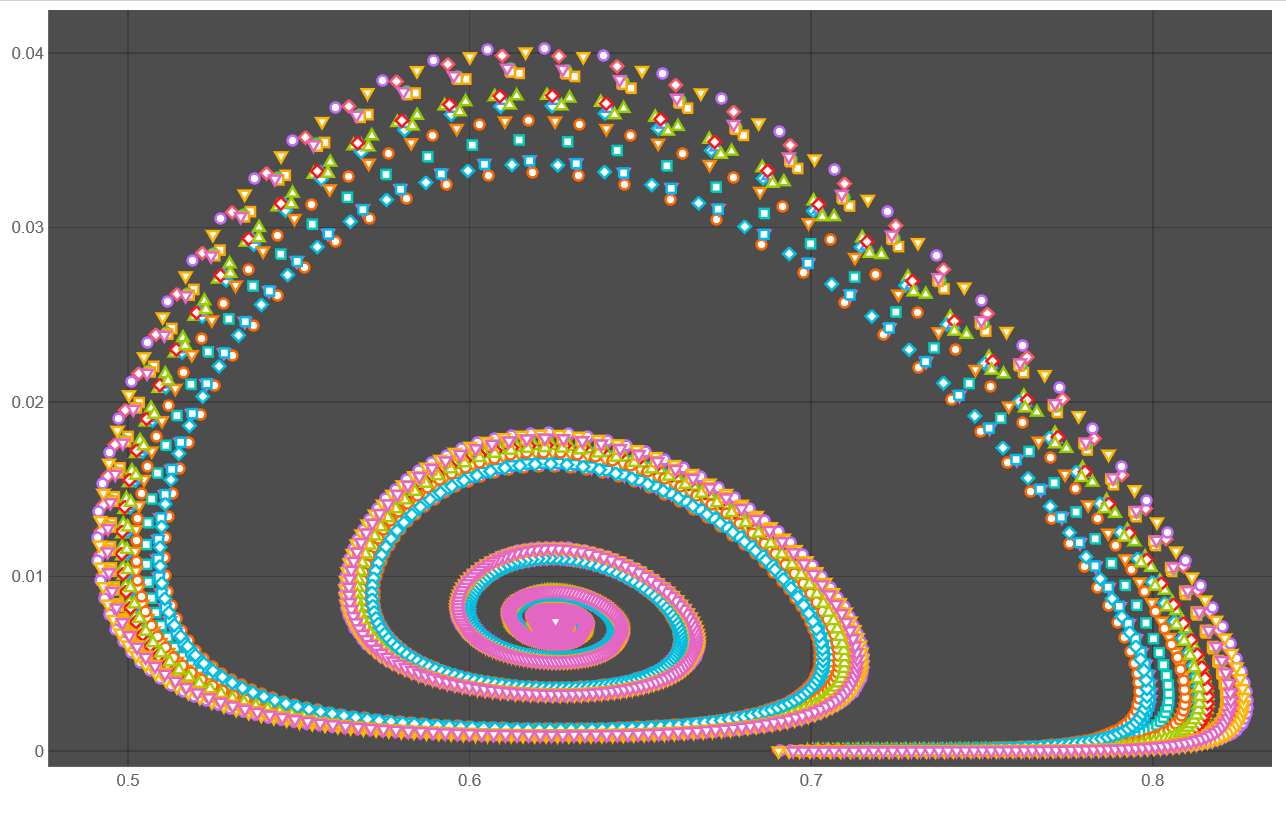
We can make projection on XY plane by dropping z from lst[i], we have

Do[lst2[i] = Table[Drop[lst[i][[j]], -1], {j, Length[lst[i]]}];, {i, 
  20}]

ListPlot[Table[Drop[lst2[i], 100], {i, 20}], PlotRange -> All, 
 PlotTheme -> "Marketing"] 

Figure 3

System has two stationary points, we can compute as

eq = {x[t + 1] == (1 - p*y[t])*x[t] + c*(1 - x[t] - y[t]), 
   y[t + 1] == (p*x[t] + b)*y[t], 
   z[t + 1] == (1 - c)*z[t] + (1 - b)*y[t]};
s = NSolve[
  eq /. {x[t + 1] -> x[t], y[t + 1] -> y[t], z[t + 1] -> z[t]}, {x[t],
    y[t], z[t]}]

Out[]= {{x[t] -> 1., y[t] -> 0., z[t] -> 0.}, {x[t] -> 0.625, 
  y[t] -> 0.00735294, z[t] -> 0.367647}}

Only last of them is stable. The question is how we can show stability of this point? Theorem states (see Theorem 4 here): Let $u_{n+1} = f(u_n)$ be an autonomous system. Let J be the Jacobian matrix of f, evaluated at v. Then

  1. v is asymptotically stable if all eigenvalues of J have magnitude less than 1.
  2. v is unstable if at least one eigenvalue of J has magnitude greater than 1.

Let check our two cases.

J = Table[Grad[eq[[i, 2]], {x[t], y[t], z[t]}], {i, 3}]

Out[]= {{0.99 - 0.8 y[t], -0.01 - 0.8 x[t], 0}, {0.8 y[t], 
  0.5 + 0.8 x[t], 0}, {0, 0.5, 0.99}}

 Eigenvalues[J /. s[[1]]]

Out[]= {1.3, 0.99, 0.99}

 Eigenvalues[J /. s[[2]]]

Out[]= {0.992059 + 0.0541935 I, 0.992059 - 0.0541935 I, 0.99 + 0. I}

 Abs[%]

Out[]= {0.993538, 0.993538, 0.99}

Therefore the first stationary point is unstable and the last one is stable.

$\endgroup$
5
  • $\begingroup$ Alex: Very clever -- beautiful ...How might I use StreamPlot to show this for just the x[t+1] and y[t+1] only? $\endgroup$
    – user42700
    Commented Aug 18, 2021 at 13:56
  • $\begingroup$ @PRG See update to my answer. $\endgroup$ Commented Aug 19, 2021 at 5:28
  • $\begingroup$ PlotTheme -> "Marketing" is a nice touch ;) $\endgroup$
    – Chris K
    Commented Aug 19, 2021 at 14:05
  • $\begingroup$ @ChrisK We understand what marketing is. :) $\endgroup$ Commented Aug 19, 2021 at 15:01
  • $\begingroup$ For a more general local stability analysis, apply the Jury's test, considering all the parameters involved as free (it is similar to Routh-Hurwitz). $\endgroup$ Commented Aug 19, 2021 at 16:41
3
$\begingroup$

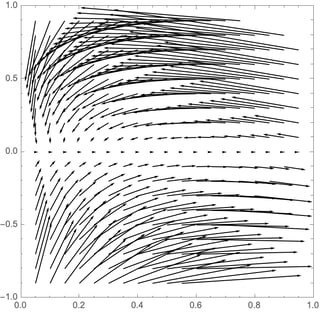
Of course trajectories are not continuous in discrete-time, so StreamPlot isn't totally relevant. See this blog post for some related discussion.

Instead, why not plot a grid of arrows, showing the action of f1?

f1 = {(1 - p*y)*x + c*(1 - x - y), (p*x + b)*y};
p = 0.8; b = 0.5; c = 0.01;

Show[Graphics[Table[
  If[{0, -1} \[VectorLess] f1 \[VectorLess] {1, 1}, Arrowheads[0.015], Arrow[{{x, y}, f1}]}]
, {x, 0.05, 0.95, 0.05}, {y, -0.9, 0.9, 0.1}]],
  Frame -> True, PlotRange -> {{0, 1}, {-1, 1}}, AspectRatio -> 1]

enter image description here

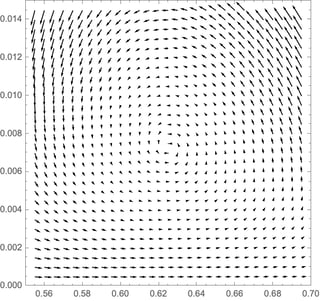
That's kind of busy, but if we zoom in to the equilibrium it will look better:

arrows = Show[Graphics[Table[
  If[{0.55, 0} \[VectorLess] f1 \[VectorLess] {0.7, 0.015}, {Arrowheads[0.015], Arrow[{{x, y}, f1}]}]
, {x, 0.555, 0.695, 0.005}, {y, 0.0005, 0.0145, 0.0005}]],
  Frame -> True, PlotRange -> {{0.55, 0.7}, {0, 0.015}}, AspectRatio -> 1]

enter image description here

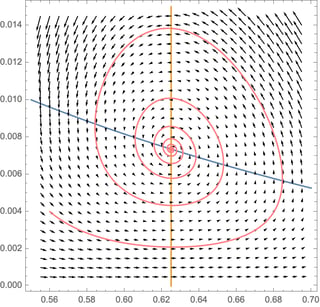
Now add isoclines and a trajectory to see the stability:

isoclines = ContourPlot[Evaluate[Thread[f1 == {x, y}]], {x, 0.55, 0.7}, {y, 0, 0.015}];

sol = RecurrenceTable[{
  x[t + 1] == (1 - p*y[t])*x[t] + c*(1 - x[t] - y[t]),
  y[t + 1] == (p*x[t] + b)*y[t], 
  x[0] == 0.56, y[0] == 0.004}, {x, y}, {t, 0, 1000}];
trajectory = ListPlot[sol, PlotStyle -> Pink, Joined -> True, PlotRange -> All];

Show[isoclines, arrows, trajectory]

enter image description here

$\endgroup$
7
  • $\begingroup$ Not working for me; what is VectorLess? I'm running ver 11.1 $\endgroup$
    – user42700
    Commented Aug 18, 2021 at 21:49
  • $\begingroup$ Hmm, introduced in v12.0 I see. For a VectorLess-less version, just do arrows = Show[Graphics[Table[f1, {Arrowheads[0.015], Arrow[{{x, y}, f1}]}, {x, 0.555, 0.695, 0.005}, {y, 0.0005, 0.0145, 0.0005}]], Frame -> True, PlotRange -> {{0.55, 0.7}, {0, 0.015}}, AspectRatio -> 1]. It will be slightly uglier, but no big deal. $\endgroup$
    – Chris K
    Commented Aug 18, 2021 at 21:58
  • $\begingroup$ Hi Chris: Sorry but in ver 11.1 I'm getting the error "Table is not a Graphics primitive or directive". $\endgroup$
    – user42700
    Commented Aug 18, 2021 at 23:26
  • $\begingroup$ Oops, should have been arrows = Show[Graphics[Table[{Arrowheads[0.015], Arrow[{{x, y}, f1}]}, {x, 0.555, 0.695, 0.005}, {y, 0.0005, 0.0145, 0.0005}]], Frame -> True, PlotRange -> {{0.55, 0.7}, {0, 0.015}}, AspectRatio -> 1] -- sorry! $\endgroup$
    – Chris K
    Commented Aug 19, 2021 at 1:22
  • $\begingroup$ Chris: That works! ... many thanks for sharing your skills in insights! $\endgroup$
    – user42700
    Commented Aug 19, 2021 at 1:59

Your Answer

By clicking “Post Your Answer”, you agree to our terms of service and acknowledge you have read our privacy policy.

Not the answer you're looking for? Browse other questions tagged or ask your own question.