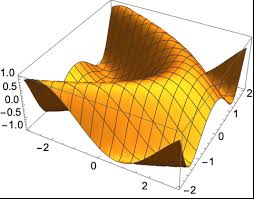
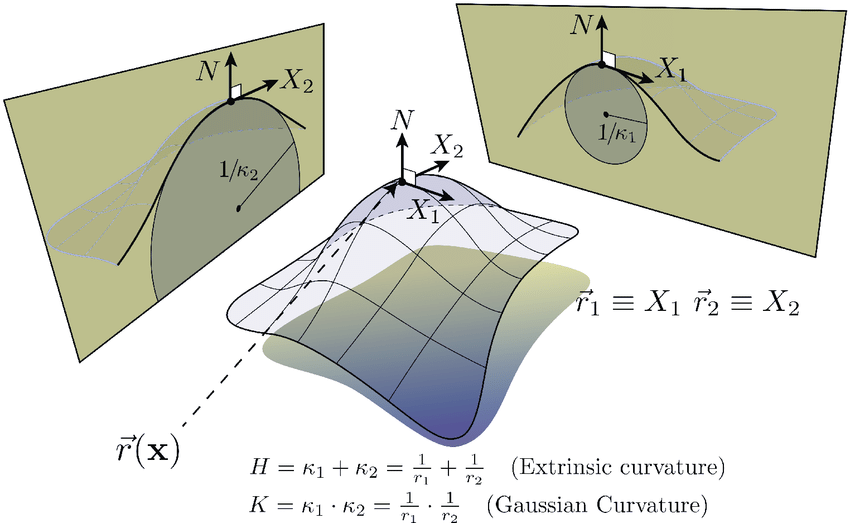
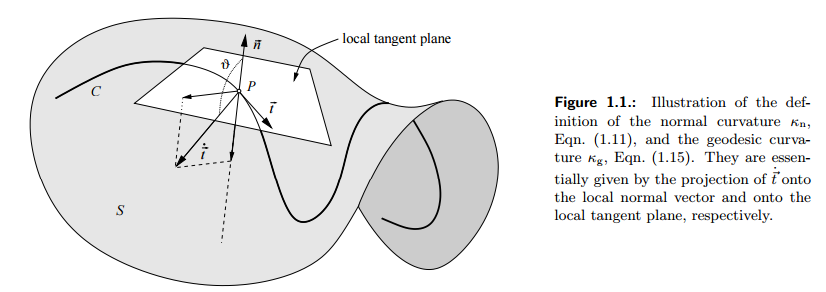
I want to draw a differential geometry diagram, but I don’t know how to draw it. I can only draw graphics like the first picture. There are many differential geometry diagrams in textbooks. What tools did they use to draw? Can MMA draw this kind of graph? This kind of picture looks very precise and beautiful!
$\begingroup$
$\endgroup$
2
-
1$\begingroup$ This picture maybe draw by CorelDraw, so it is not the real 3D object. $\endgroup$– cvgmtCommented Aug 6, 2021 at 9:30
-
$\begingroup$ Keenan Crane explains on his website how he uses a combination of tools to create these images $\endgroup$– DunlopCommented Aug 6, 2021 at 19:48
Add a comment
|
2 Answers
$\begingroup$
$\endgroup$
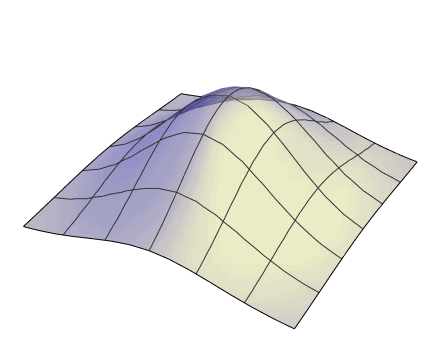
This might help for achieving something closer to the effect in the central diagram, but, apart from the Frenet frame and the curve, you're going to need to photoshop the rest together:
Plot3D[Exp[(-1.7 x^2 - y^2)/3], {x, -2, 2}, {y, -2, 2},
 Boxed -> False, Axes -> False, Mesh -> 5,
 PlotStyle -> {GoochShading[{
     LABColor[0.268505119996119, 0.26589133685332694`, -0.5698407894340829],
     LABColor[0.9838025798885295, -0.1047406804200568, 0.48599170232069433`]}],
    Opacity[.8], GrayLevel[.75], Thick, Lighting -> "Neutral"}]
$\begingroup$
$\endgroup$
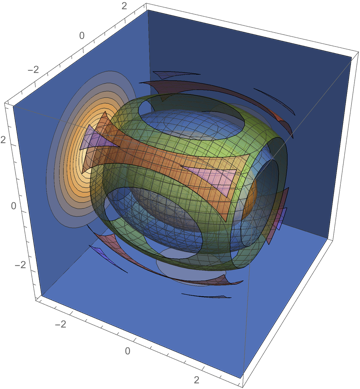
A start:
aaa = SliceContourPlot3D[
  PDF[MultinormalDistribution[{0, 0,
     0}, {{2, 0, 0}, {0, 1, 0}, {0, 0, 1}}], {x, y, z}],
  "BackPlanes", {x, -3, 3}, {y, -3, 3}, {z, -3, 3}, Contours -> 10];
bbb = ContourPlot3D[
  x^2/2 + y^2 + z^2,
  {x, -2, 2}, {y, -2, 2}, {z, -2, 2},
  Contours -> 5,
  ContourStyle -> Opacity[0.5]];
Show[aaa,bbb]

