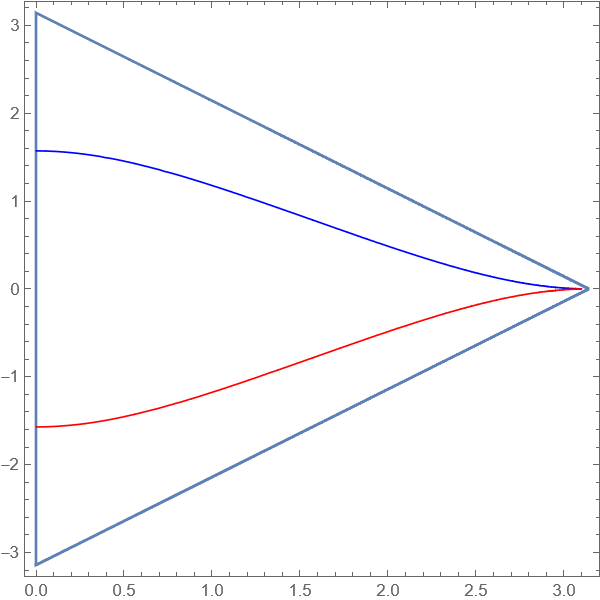
Consider a region in the $(R,T)$ plane defined by the conditions $$0 < R\leq \pi,\quad |T|+R<\pi\tag{1}$$
Define $t(R,T)$ to be $$t(R,T)=\dfrac{1}{2}\left(\tan\left(\dfrac{T-R}{2}\right)+\tan\left(\dfrac{T+R}{2}\right)\right)\tag{2}.$$
I want to plot level sets of $t(R,T)$ inside the region defined by conditions (1). To do so I used the following code
t[R_, T_] := 1/2 (Tan[(T - R)/2] + Tan[(T + R)/2])
cond1 = 0 <= R <= Pi && Abs[T] + R < Pi && R \[Element] Reals && T \[Element] Reals
cond2 = Reduce[cond1, {R, T}]
reg1 = ImplicitRegion[cond2, {{R, -\[Infinity], \[Infinity]}, {T, -\[Infinity], \[Infinity]}}]
Show[RegionPlot[reg1, PlotStyle -> None], ContourPlot[t[R, T] == -1, {R, T} \[Element] reg1], ContourPlot[t[R, T] == 1, {R, T} \[Element] reg1]]
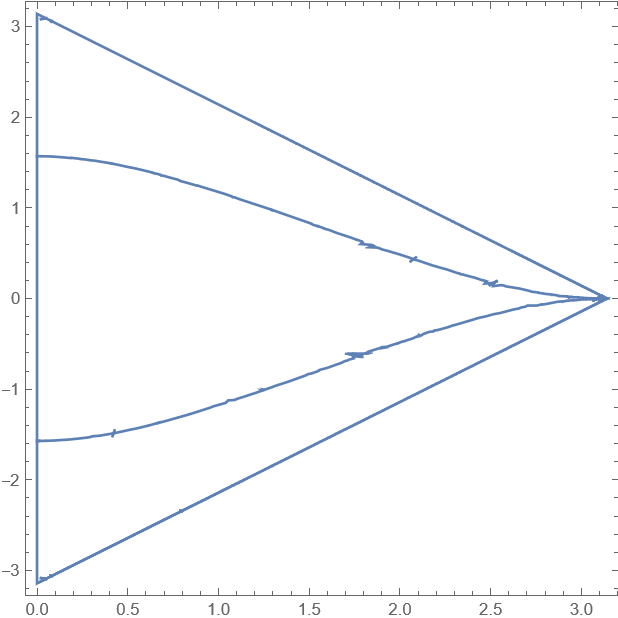
The resulting plot, however, does not show smooth curves.
What is the issue here? Why isn't Mathematica plotting these curves smoothly? How can I correct that?


PlotPoints -> 100? Suggestion: Never use upper-case names for variables (e.g., $R, T, ...$) as they can conflict with internal variable and function names. Also, use semicolons to end lines. $\endgroup$