2
$\begingroup$

(i)

Consider the system:

$$\frac{dS}{dt} =-\frac{\beta S I }{N}+ \gamma I$$ $$\frac{dI}{dt} = \frac{\beta S I }{N} - \gamma I$$

where $N=S+I$.

The equilibrium points being:

$$e_1:(S^*, I^*) = (N,0)$$ $$e_2:(S^*, I^*) = \left(\frac{\gamma N}{\beta}, \frac{N(\beta-\gamma)}{\beta} \right)$$

For simplicity we normalise $N$ to $1$.

The eigenvalues for $e_1$ (after substituting $e_1$ into the Jacobian) being:

$$ \lambda_1 =0,\\ \lambda_2 = \beta - \gamma.$$

The eigenvalues for $e_2$ (after substituting $e_2$ into the Jacobian) being:

$$\lambda_1 =0,\\ \lambda_2 = \gamma - \beta.$$

From the Jacobian we know $e_1$ is stable if $\beta < \gamma$ (or $R_0<1$) and unstable if $\beta>\gamma$ (or $R_0>1$).

Similarly for $e_2$ we see it is stable for $\beta > \gamma$ (or $R_0 > 1$) and unstable if $\beta<\gamma$ (or $R_0<1$).

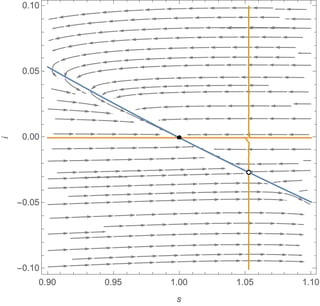
How can we show these 4 plots where $R_0<1$ in one case and $R_0>1$ in another?

(ii)

$$\frac{dS}{dt}=-\frac{\beta S I}{N} + \xi R$$

$$\frac{dI}{dt}=\frac{\beta S I}{N} - \gamma I$$

$$\frac{dR}{dt}=\gamma I - \xi R$$

where $N=S+I+R$.

The equilibrium points being:

$$e_1 : (S^*,I^*, R^*) = \left(N, 0, 0 \right)$$ $$e_2 : (S^*, I^*, R^*) = \left(\frac{N\gamma}{\beta}, \frac{N\xi}{\gamma + \xi}\left(1- \frac{\gamma}{\beta}\right), \frac{N \gamma}{\gamma + \xi}\left(1-\frac{\gamma}{\beta} \right) \right)$$

The eigenvalues for $e_1$ (after substituting $e_1$ into the Jacobian) being:

$$\lambda_1 =0,\\ \lambda_2 = -\xi, \\ \lambda_3 = \beta- \gamma.$$

The eigenvalues for $e_2$ (after substituting $e_2$ into the Jacobian) being:

$$\lambda_1 =0,\\ \lambda_2 = \frac{-\xi\left(\beta +\xi\right) + \sqrt{\xi^2 \left(\beta +\xi\right)^2 -4\xi \left(\gamma+\xi\right)^2\left(\beta -\gamma\right)} }{2\left(\gamma + \xi\right)}, \\[2ex] \lambda_3 = \frac{-\xi\left(\beta +\xi\right) - \sqrt{\xi^2 \left(\beta +\xi\right)^2 -4\xi \left(\gamma+\xi\right)^2\left(\beta -\gamma\right)} }{2\left(\gamma + \xi\right)}.$$

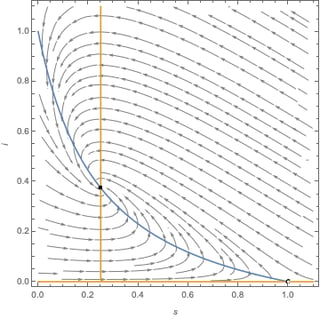
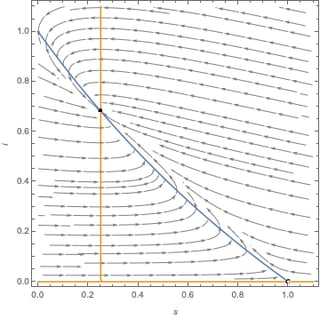
Stability of $e_2$ has different cases, for different inputs $(\beta,\gamma$ and $\xi)$ we have three different stability points; a saddle point, a stable node, and a stable focus. How can we show this in a vector plot?

EDIT

Addendum (i)

Consider the system:

$$\frac{dS}{dt}=-\frac{\beta S I}{N}$$ $$\frac{dI}{dt}=\frac{\beta S I}{N}$$

where $N=S+I$.

The equilibrium points I have are:

$$e_1 : \left( S_1^*, I_1^*\right)= \left(N, 0\right), \\ e_2 : \left( S_1^*, I_1^*\right)= \left(0, N\right)$$

But this model is a little strange because I get an answer of (s,i) = (0,0) when I use your code.. any ideas why?

Addendum (ii)

$$\frac{dS}{dt}=\mu N -\frac{\beta S I}{N} -\nu S$$

$$\frac{dE}{dt}=\frac{\beta S I}{N} - \sigma E - \nu E$$

$$\frac{dI}{dt}=\sigma E -\nu I$$

where $N=S+E+I$ is the total population.

Using your code:

e := n - s - i;
SetModel[{Pop[
    pop] -> {Component[
      s] -> {Equation :> \[Mu] n - \[Beta] s i/n - \[Nu] s}, 
    Component[i] -> {Equation :> \[Sigma] e - \[Nu] i}}, 
  Parameters :> {\[Beta] > 0, \[Sigma] > 0, \[Mu] > 0, \[Nu] > 0, 
    n > 0}}]
eq = SolveEcoEq[]

gives:

{{s -> (n \[Nu]^2 + n \[Beta] \[Sigma] + n \[Nu] \[Sigma] - 
    Sqrt[-4 \[Beta] \[Sigma] (n^2 \[Mu] \[Nu] + 
        n^2 \[Mu] \[Sigma]) + (-n \[Nu]^2 - n \[Beta] \[Sigma] - 
       n \[Nu] \[Sigma])^2])/(2 \[Beta] \[Sigma]), 
  i -> (-((n \[Nu]^2)/\[Beta]) + n \[Sigma] - (
    n \[Nu] \[Sigma])/\[Beta] + 
    Sqrt[-4 \[Beta] \[Sigma] (n^2 \[Mu] \[Nu] + 
        n^2 \[Mu] \[Sigma]) + (-n \[Nu]^2 - n \[Beta] \[Sigma] - 
       n \[Nu] \[Sigma])^2]/\[Beta])/(2 (\[Nu] + \[Sigma]))}, {s -> (
   n \[Nu]^2 + n \[Beta] \[Sigma] + n \[Nu] \[Sigma] + 
    Sqrt[-4 \[Beta] \[Sigma] (n^2 \[Mu] \[Nu] + 
        n^2 \[Mu] \[Sigma]) + (-n \[Nu]^2 - n \[Beta] \[Sigma] - 
       n \[Nu] \[Sigma])^2])/(2 \[Beta] \[Sigma]), 
  i -> (-((n \[Nu]^2)/\[Beta]) + n \[Sigma] - (
    n \[Nu] \[Sigma])/\[Beta] - 
    Sqrt[-4 \[Beta] \[Sigma] (n^2 \[Mu] \[Nu] + 
        n^2 \[Mu] \[Sigma]) + (-n \[Nu]^2 - n \[Beta] \[Sigma] - 
       n \[Nu] \[Sigma])^2]/\[Beta])/(2 (\[Nu] + \[Sigma]))}}

which seems incorrect as we don't have a disease-free equilibrium point. My equilibrium points were:

$$e_1 : \left( S_1^*, E_1^*, I_1^*\right)= \left(N, 0, 0\right), \\ e_2 : \left( S_2^*, E_2^*, I_2^*\right)= \left(\frac{N\nu\left(\sigma + \nu\right)}{\beta \sigma},\frac{N\nu^2 \left( \sigma + \nu \right) \left( \frac{\beta \sigma}{\nu\left(\sigma+\nu\right)} -1 \right) }{\beta\sigma\left(\sigma +\nu \right)} , \frac{N\nu\sigma \left( \sigma + \nu \right) \left( \frac{\beta \sigma}{\nu\left(\sigma+\nu\right)} -1 \right) }{\beta\sigma\left(\sigma +\nu \right)}\right)\\\\$$

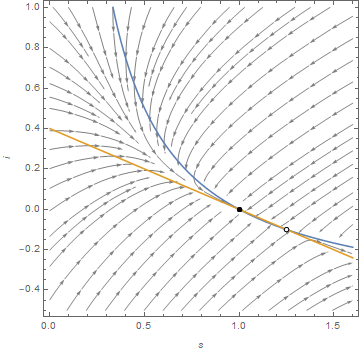
The plot using the following:

\[Beta] = 0.6; \[Sigma] = 0.2; \[Mu] = 0.3; \[Nu] = 0.3; n = 1;
eq = SolveEcoEq[]
N[EcoEigenvalues[eq[[2]]]]
Show[PlotEcoPhasePlane[{s, 0, 1.6}, {i, -0.5, 1}], 
 RuleListPlot[eq, PlotMarkers -> EcoStableQ[eq]]]

enter image description here

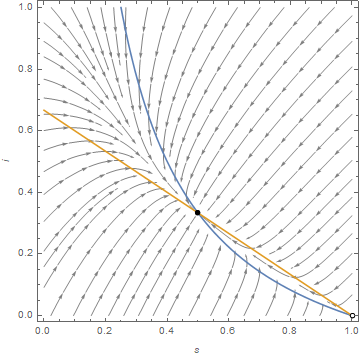
And similarly

\[Beta] = 0.6; \[Sigma] = 0.4; \[Mu] = 0.2; \[Nu] = 0.2; n = 1;
eq = SolveEcoEq[]
N[EcoEigenvalues[eq[[2]]]]
Show[PlotEcoPhasePlane[{s, 0, 1}, {i, 0, 1}], 
 RuleListPlot[eq, PlotMarkers -> EcoStableQ[eq]]]

enter image description here

Addendum (iii)

$$\frac{dS}{dt}=\mu N -\frac{\beta S I}{N} + \gamma I -\nu S$$

$$\frac{dE}{dt}=\frac{\beta S I}{N} - \sigma E - \nu E$$

$$\frac{dI}{dt}=\sigma E - \gamma I -\nu I$$

where $N=S+E+I$ is the total population.

Using your code, we have:

e := n - s - i;
SetModel[{Pop[
    pop] -> {Component[
      s] -> {Equation :> \[Mu] n - \[Beta] s i/
          n + \[Gamma] i - \[Nu] s}, 
    Component[i] -> {Equation :> \[Sigma] e - \[Gamma] i - \[Nu] i}}, 
  Parameters :> {\[Beta] > 0, \[Gamma] > 0, \[Sigma] > 0, \[Mu] > 
     0, \[Nu] > 0, n > 0}}]
eq = SolveEcoEq[]

giving:

{{s -> n, i -> 0}, {s -> (n \[Gamma])/\[Beta], 
  i -> -((n (-\[Beta] + \[Gamma]) \[Sigma])/(\[Beta] (\[Gamma] + \
\[Sigma])))}}

The first equilibrium point is correct however the second is wrong, from my results anyway. I get:

$$e_2 : \left( S_2^*, E_2^*, I_2^*\right)= \left(\frac{N \left(\gamma+\nu\right)\left(\sigma+\nu \right)}{\beta \sigma}, \frac{N\left(\gamma+\nu\right)^2\left(\sigma+\nu\right)}{\beta\sigma \left(\gamma + \sigma+\nu\right)}\left(\frac{\beta\sigma}{\left(\gamma+\nu\right)\left(\sigma+\nu\right)}-1\right), \frac{N\sigma\left(\gamma+\nu\right)\left(\sigma+\nu\right)}{\beta\sigma \left(\gamma + \sigma+\nu\right)}\left(\frac{\beta\sigma}{\left(\gamma+\nu\right)\left(\sigma+\nu\right)}-1\right)\right)\\[1ex]$$

Can you do what you did in your answer below for the addendum systems?

$\endgroup$
13
  • 2
    $\begingroup$ Take a look at the examples in the documentation of StreamPlot, particularly the Applications section $\endgroup$
    – Lukas Lang
    Commented Jun 23, 2021 at 12:28
  • 1
    $\begingroup$ Please do not post LateX code; there's no easy way to copy this into Mathematica to try things out. Make it easy for people to try and answer your question. $\endgroup$ Commented Jun 29, 2021 at 12:28
  • $\begingroup$ @SjoerdSmit whenever I try posting a question using math mode, I get formatting errors for some reason.. $\endgroup$
    – Math
    Commented Jun 29, 2021 at 12:33
  • $\begingroup$ @Math Re: formatting, you don't need the spaces before display equations. As for your addendum problem ii), is there an $R$ missing or a typo? Right now $N=S+E+I$ is not constant -- if you check $dN/dt=dS/dt+dE/dt+dI/dt$ it doesn't equal zero. $\endgroup$
    – Chris K
    Commented Jul 6, 2021 at 18:22
  • $\begingroup$ @ChrisK there is no $R$ missing. This is the SEIS model. I should've mentioned $\mu = \nu$ to maintain constant population hence the summation of the system will be zero. I have given the bounty and best answer to you but I hope you can help me out with the addendum :) $\endgroup$
    – Math
    Commented Jul 7, 2021 at 10:57

1 Answer 1

9
+50
$\begingroup$

To make it easy, I'll use my EcoEvo package.

First time, you'll need to install it:

PacletInstall["EcoEvo", "Site" -> "http://raw.githubusercontent.com/cklausme/EcoEvo/master"]

Then, load the package to get started:

<<EcoEvo`

Both models are a little bit funny, in that total population size is conserved. Thus, model (i) is effectively one-dimensional and model (ii) is effectively two-dimensional.

Model (i): SI

SetModel[{
  Pop[pop] -> {
    Component[s] -> {Equation :> -β s i/n + γ i},
    Component[i] -> {Equation :> β s i/n - γ i}
  },
  Parameters :> {β > 0, γ > 0, n > 0}
}]

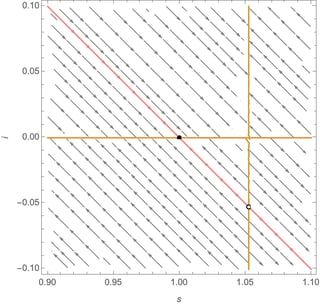
Let's go straight to the phase planes using PlotEcoPhasePlane, manually adding the total population constraint as a pink straight line. The no-disease case (disease-free equilibrium eq[[1]] is stable, the other equilibrium eq[[2]] is biologically meaningless since s > n and i < 0):

β = 0.95; γ = 1; n = 1;
Show[
 PlotEcoPhasePlane[{s, 0.9, 1.1}, {i, -0.1, 0.1}],
 Plot[n - s, {s, 0.9, 1.1}, PlotStyle -> Pink],
 RuleListPlot[{{s -> n, i -> 0}, {s -> (n γ)/β, i -> n - (n γ)/β}}, PlotMarkers -> {True, False}]
 ]

enter image description here

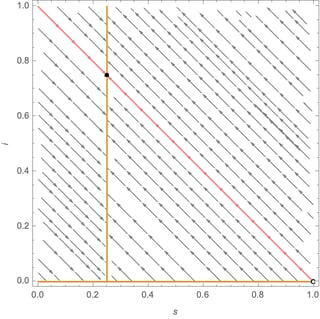
and the endemic case (endemic equilibrium eq[[2]] is stable):

β = 4; γ = 1; n = 1;
Show[
 PlotEcoPhasePlane[{s, 0, 1}, {i, 0, 1}],
 Plot[n - s, {s, 0, n}, PlotStyle -> Pink],
 RuleListPlot[{{s -> n, i -> 0}, {s -> (n γ)/β, i -> n - (n γ)/β}}, PlotMarkers -> {False, True}]
]

enter image description here

Again, because of the total-population constraint, this is effectively a one-dimensional system with either two or one feasible (non-negative) equilibria. Note that the two different isoclines ($S$ and $I$) overlap completely because of this and just look gold.

Model (ii): SIR

Here we can get rid of the degeneracy by defining r := n - s - i, then work in the SI phase-plane.

r := n - s - i;
SetModel[{
  Pop[pop] -> {
    Component[s] -> {Equation :> -β s i/n + ξ r},
    Component[i] -> {Equation :> β s i/n - γ i}
  },
  Parameters :> {β > 0, γ > 0, ξ > 0, n > 0}
}]

To verify your analytical results:

eq = SolveEcoEq[]

enter image description here

EcoEigenvalues[eq[[1]]]

enter image description here

EcoEigenvalues[eq[[2]]]

enter image description here

The eigenvalues of the non-trivial equilibrium are ugly, but we can check stability using Routh-Hurwitz criteria in EcoStableQ:

Simplify[EcoStableQ[eq[[2]]]]

enter image description here

On to the phase planes. The $S$-isocline is blue, the $I$-isocline is gold.

No-disease case (eq[[1]] is stable, eq[[2]] is a biologically meaningless saddle point):

β = 0.95; γ = 1; ξ = 1; n = 1;
eq = SolveEcoEq[]
N[EcoEigenvalues[eq[[2]]]]
Show[
 PlotEcoPhasePlane[{s, 0.9, 1.1}, {i, -0.1, 0.1}],
 RuleListPlot[eq, PlotMarkers -> EcoStableQ[eq]]
]
(* {{s -> 1., i -> 0}, {s -> 1.05263, i -> -0.0263158}} *)
(* {-1.02384, 0.0488359} *)

enter image description here

Endemic case 1 (eq[[2]] is a stable focus, due to complex eigenvalues):

β = 4; γ = 1; ξ = 1; n = 1;
eq = SolveEcoEq[]
N[EcoEigenvalues[eq[[2]]]]
Show[
 PlotEcoPhasePlane[{s, 0, 1.1}, {i, 0, 1.1}],
 RuleListPlot[eq, PlotMarkers -> EcoStableQ[eq]]
]
(* {{s -> 1, i -> 0}, {s -> 1/4, i -> 3/8}} *)
(* {-1.25 + 1.19896 I, -1.25 - 1.19896 I} *)

enter image description here

Endemic case 2 (eq[[2]] is a stable node, due to negative real eigenvalues):

β = 4; γ = 1; ξ = 10; n = 1;
eq = SolveEcoEq[]
N[EcoEigenvalues[eq[[2]]]]
Show[
 PlotEcoPhasePlane[{s, 0, 1.1}, {i, 0, 1.1}],
 RuleListPlot[eq, PlotMarkers -> EcoStableQ[eq]]
]
(* {{s -> 1, i -> 0}, {s -> 1/4, i -> 15/22}} *)
(* {-9.60337, -3.1239} *)

enter image description here

$\endgroup$
9
  • $\begingroup$ This is nice, however can we show all four vector plots for say part (i)? stable and unstable plots for both $e_1$ and $e_2$ for a given $R_0$? Currently we only see the respective Vector plots as a result of our inputs. $\endgroup$
    – Math
    Commented Jun 30, 2021 at 14:17
  • $\begingroup$ Also, in model (ii), we have a saddle point when $\beta = 0.95$, $\gamma=1$ and $\xi=0.5$ $\endgroup$
    – Math
    Commented Jun 30, 2021 at 14:40
  • $\begingroup$ Also, the total population line(blue line) isn't a linear in model (ii) (stable focus plot), why? $\endgroup$
    – Math
    Commented Jun 30, 2021 at 15:33
  • $\begingroup$ @Math I tried to clarify my answer. I made the total-population constraint line pink in model (i), to distinguish it from the isoclines. The total-population constraint doesn't show up in model (ii), because we use it to eliminate $R$ to make the system two-dimensional. I extended the axes in the no-disease case to show the other equilibrium, but it's biologically meaningless ($S>N$ and $I<0$ don't make biological sense). Finally, since you can now see both equilibria in every plot, there's no need for separate figures for each equilibrium (in fact, it's nice to see the global picture). $\endgroup$
    – Chris K
    Commented Jun 30, 2021 at 16:00
  • $\begingroup$ I should add, you have the zero eigenvalues because you work on the full system and I don't have them in model (ii) because I have eliminated $R$. $\endgroup$
    – Chris K
    Commented Jun 30, 2021 at 16:12

Your Answer

By clicking “Post Your Answer”, you agree to our terms of service and acknowledge you have read our privacy policy.

Not the answer you're looking for? Browse other questions tagged or ask your own question.