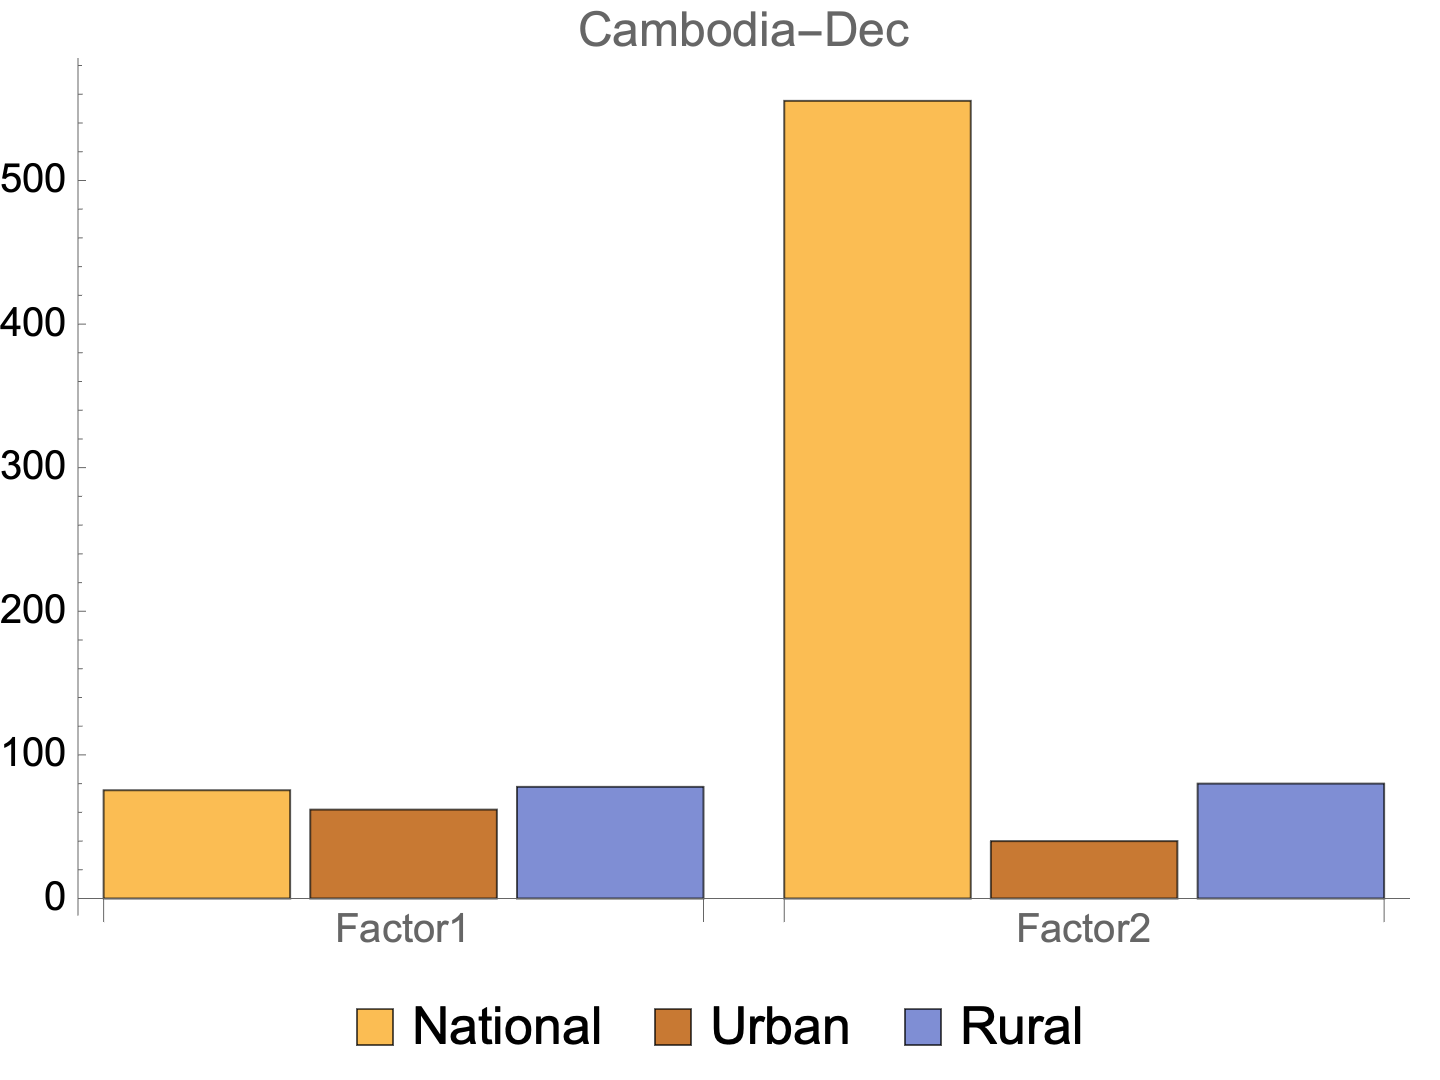
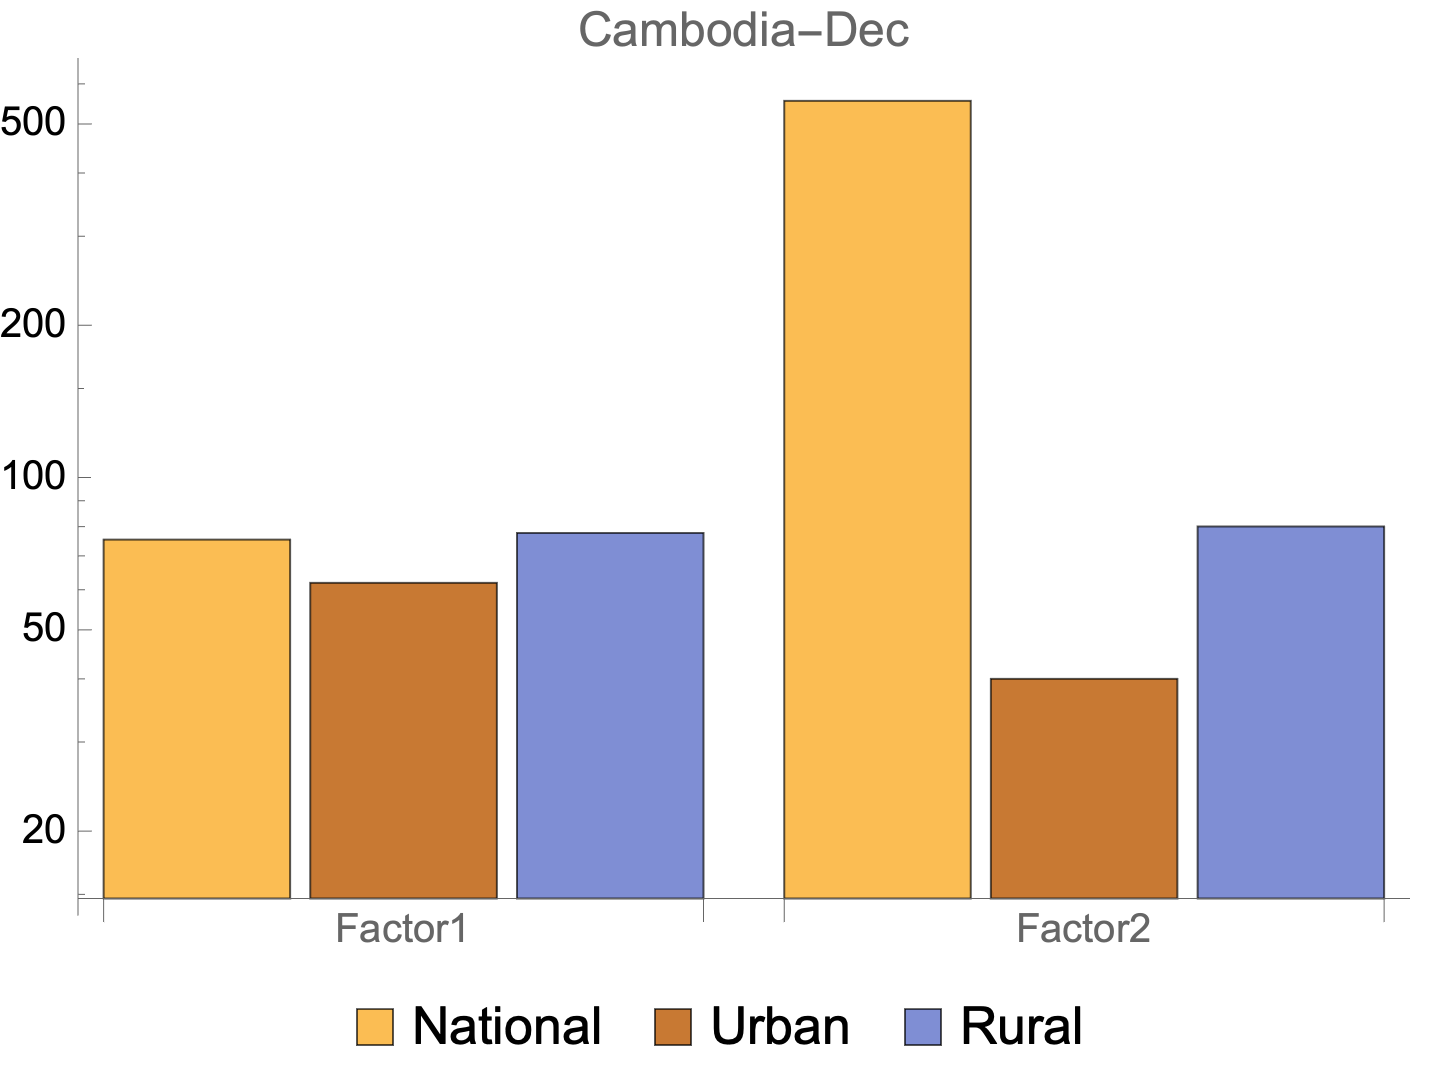
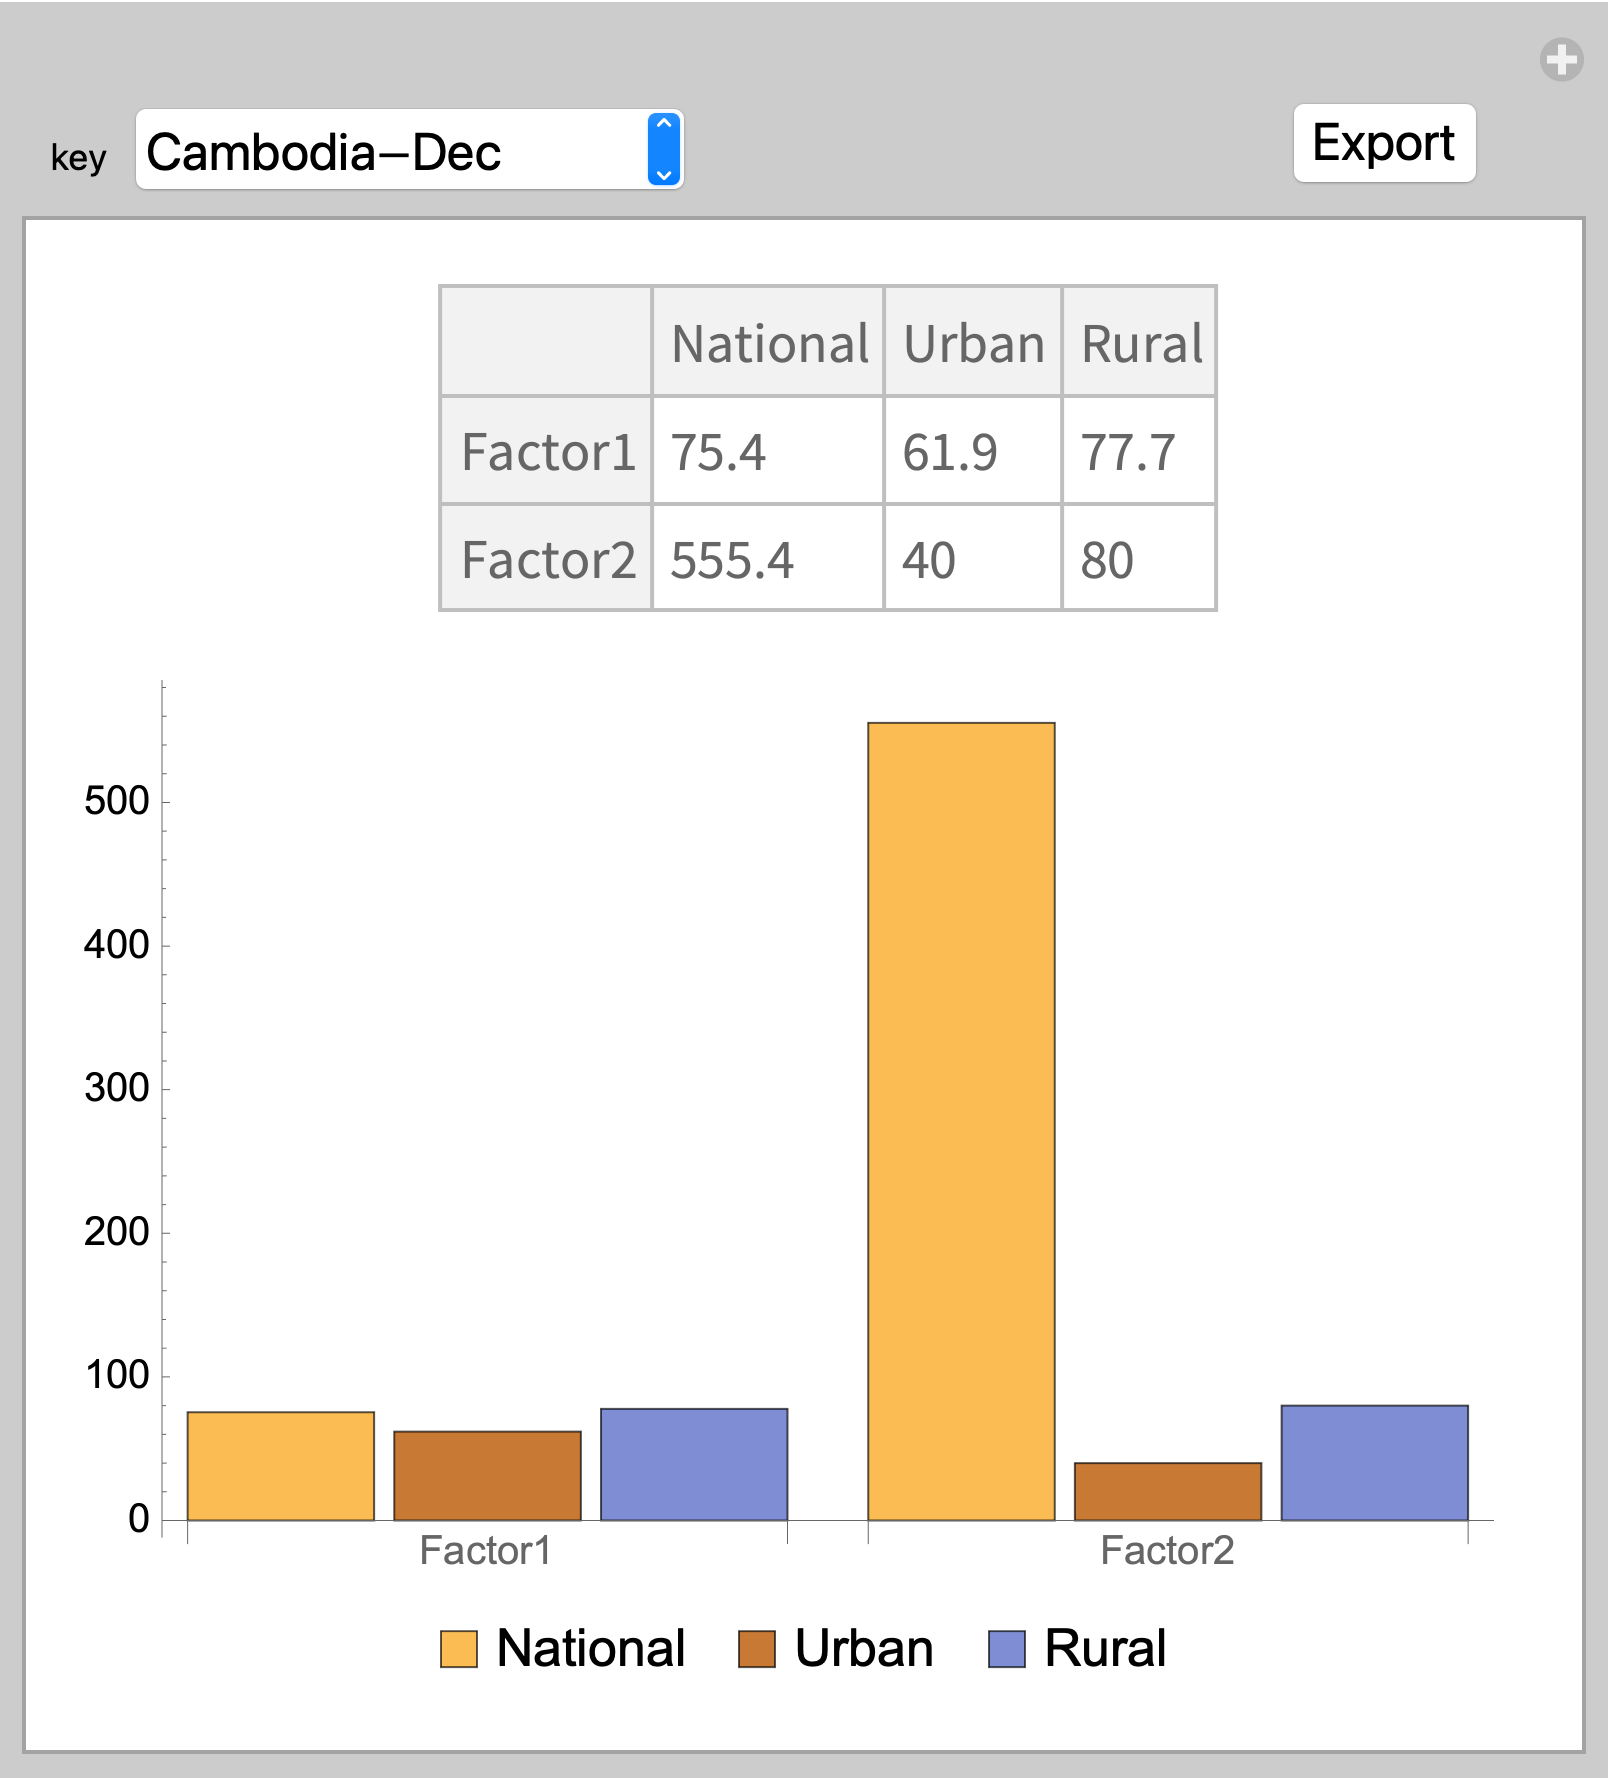
I have the following code to generate two separate bar charts. I like to create a new bar chart by extracting the data from the following barcharts.
bc1 = BarChart[
   <|"Cambodia-Dec" -> <|"National" -> 75.4, "Urban" -> 61.9,
      "Rural" -> 77.7|>,
    "Indonesia-May" -> <|"National" -> 79.8, "Urban" -> 78.7,
      "Rural" -> 81.8|>,
    "Lao PDR-Jul" -> <|"National" -> 27.0, "Urban" -> 28.8,
      "Rural" -> 26.0|>,
    "Mongolia-Dec" -> <|"National" -> 17.5, "Urban" -> 19.3,
      "Rural" -> 14.1|>,
    "Myanmar-Oct" -> <|"National" -> 52.8, "Urban" -> 54.9,
      "Rural" -> 51.7|>,
    "Philippines-Dec" -> <|"National" -> 75.8, "Urban" -> 78.4,
      "Rural" -> 72.9|>,
    "Solomon Islands-Jun" -> <|"National" -> 32.3, "Urban" -> 33.1,
      "Rural" -> 32.2|>|>,
   ChartLabels -> {{"Cambodia\nDec", "Indonesia\nMay", "Lao PDR\nJul",
       "Mongolia\nDec", "Myanmar\nOct", "Philippines\nDec",
      "Solomon Isl.\nJun"}, None},
   ChartLegends -> Placed[{"National", "Urban", "Rural"}, Below],
   PlotTheme -> "Business",
   PlotLabel -> "Factor 1",
   Frame -> {{True, True}, {True, True}},
   FrameLabel -> {None, "% of households"},
   BarSpacing -> None
   ];

bc2 = BarChart[
   <|"Cambodia-Dec" -> <|"National" -> 555.4, "Urban" -> 40,
      "Rural" -> 80|>,
    "Indonesia-May" -> <|"National" -> 25.8, "Urban" -> 80,
      "Rural" -> 81.8|>,
    "Lao PDR-Jul" -> <|"National" -> 27.0, "Urban" -> 45,
      "Rural" -> 26.0|>,
    "Mongolia-Dec" -> <|"National" -> 17.5, "Urban" -> 30,
      "Rural" -> 14.1|>,
    "Myanmar-Oct" -> <|"National" -> 52.8, "Urban" -> 54.9,
      "Rural" -> 51.7|>,
    "Philippines-Dec" -> <|"National" -> 40, "Urban" -> 25,
      "Rural" -> 72.9|>,
    "Solomon Islands-Jun" -> <|"National" -> 32.3, "Urban" -> 33.1,
      "Rural" -> 32.2|>|>,
   ChartLabels -> {{"Cambodia\nDec", "Indonesia\nMay", "Lao PDR\nJul",
       "Mongolia\nDec", "Myanmar\nOct", "Philippines\nDec",
      "Solomon Isl.\nJun"}, None},
   ChartLegends -> Placed[{"National", "Urban", "Rural"}, Below],
   PlotTheme -> "Business",
   PlotLabel -> "Factor 2",
   Frame -> {{True, True}, {True, True}},
   FrameLabel -> {None, "% of households"},
   BarSpacing -> None
   ];
If I want to create a new bar chart only for Cambodia, for example, I will have to extract the Cambodia data from each bar chart manually, which I do not want to do because I have many bar charts to do this operation. Rather I like to do the data extraction using Mathematica and create the new bar chart desired.


FullFormofbc1and it doesn't look as if the data can be easily extracted from the plot. $\endgroup$