Bug introduced in Version 8 or earlier, and persisting through 12.1.
I have the following code:
ser[x_] = FourierSeries[(π^2 + a)/(3 x^2 + a), x, 10] // N // Chop
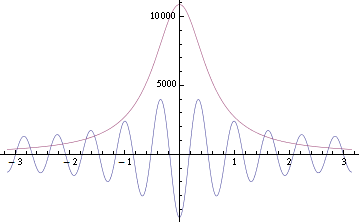
It gives me some series, which I then try to plot. And surprisingly, the result isn't even similar to the function I passed to FourierSeries[]: for comparison, I've used this code:
Plot[{ser[x], 1000 (π^2 + a)/(3 x^2 + a)}, {x, -π, π}]

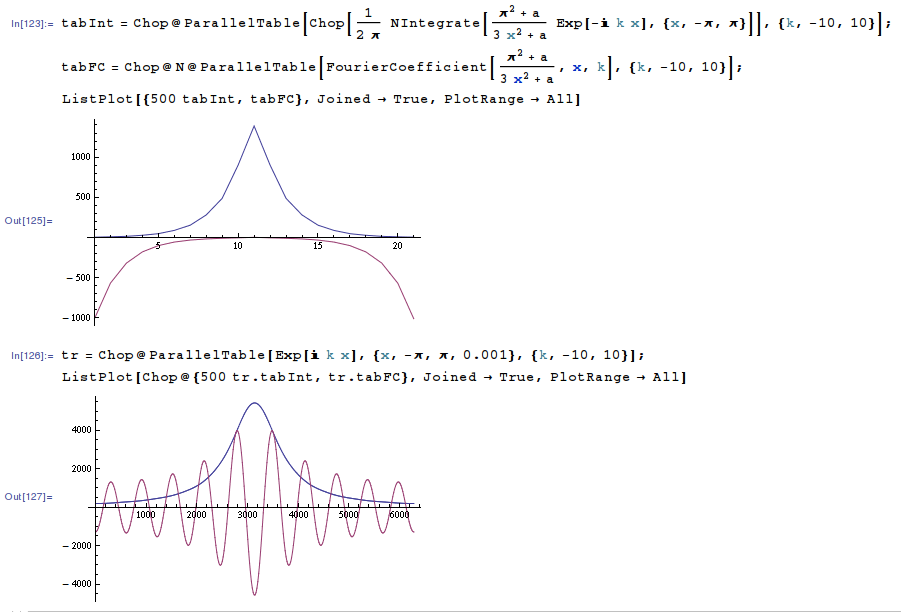
Fourier transform for function given in documentation works correctly, while for this one doesn't. I've tried using directly the formula given in documentation as default formula (used NIntegrate[]), and that gives me expected results.
What have I done wrong? Is this a bug?
Addition to answer comments:

As one can see, the Fourier coefficients computed via NIntegrate[] are quite different from ones generated by FourierCoefficient[].
Update:
As pointed in comments, setting GenerateConditions->True appears to yield correct result, not generating any conditions though. Why should this be needed?

FourierCosSeriesworks fine. Are you sure it can't be the feature of the Laplace distribution for its series to behave like this? $\endgroup$GenerateConditions -> True, then it will yield the correct result somehow, without any actual conditions generated. And maybe edit you question asking whyFourierCoefficientdoes this. $\endgroup$